Table of Contents
GHG Tracker
Overview
![]()
See our project here: Project Repository
GHG Tracker is a web application designed to track the carbon footprint that residents of Hawai’i produce and reduce. Our focus is on Greenhouse Gas Emissions (GHG) and how it is everyone’s responsibility. This web app focuses on tackling GHG from Transportation. Climate change has the potential to increase the severity and frequency of hurricanes, flooding, and droughts, and is expected to lead to increasing sea level rise. GHG is the most significant factor in climate change.
This app allows users to update their daily mode of transportation and track the effect of each time they use a mode of transportation. The user will have a custom profile by adding their cars, alternative modes of transportation (bike, walk, bus, etc.), personal goals, and a history of their data. By using real data from all models and makes of cars, as the user continues to use the app, it will update and calculate the total amount of carbon produced, reduced, fuel saved and total miles traveled.
Resources
- Computation of GHG produced/reduced: Greenhouse Gases Equivalencies Calculator - Calculations and References
- Amount of CO2 a tree can absorb in a year: All About Trees
Screenshots
Presented below is a walkthrough of the pages of our application.
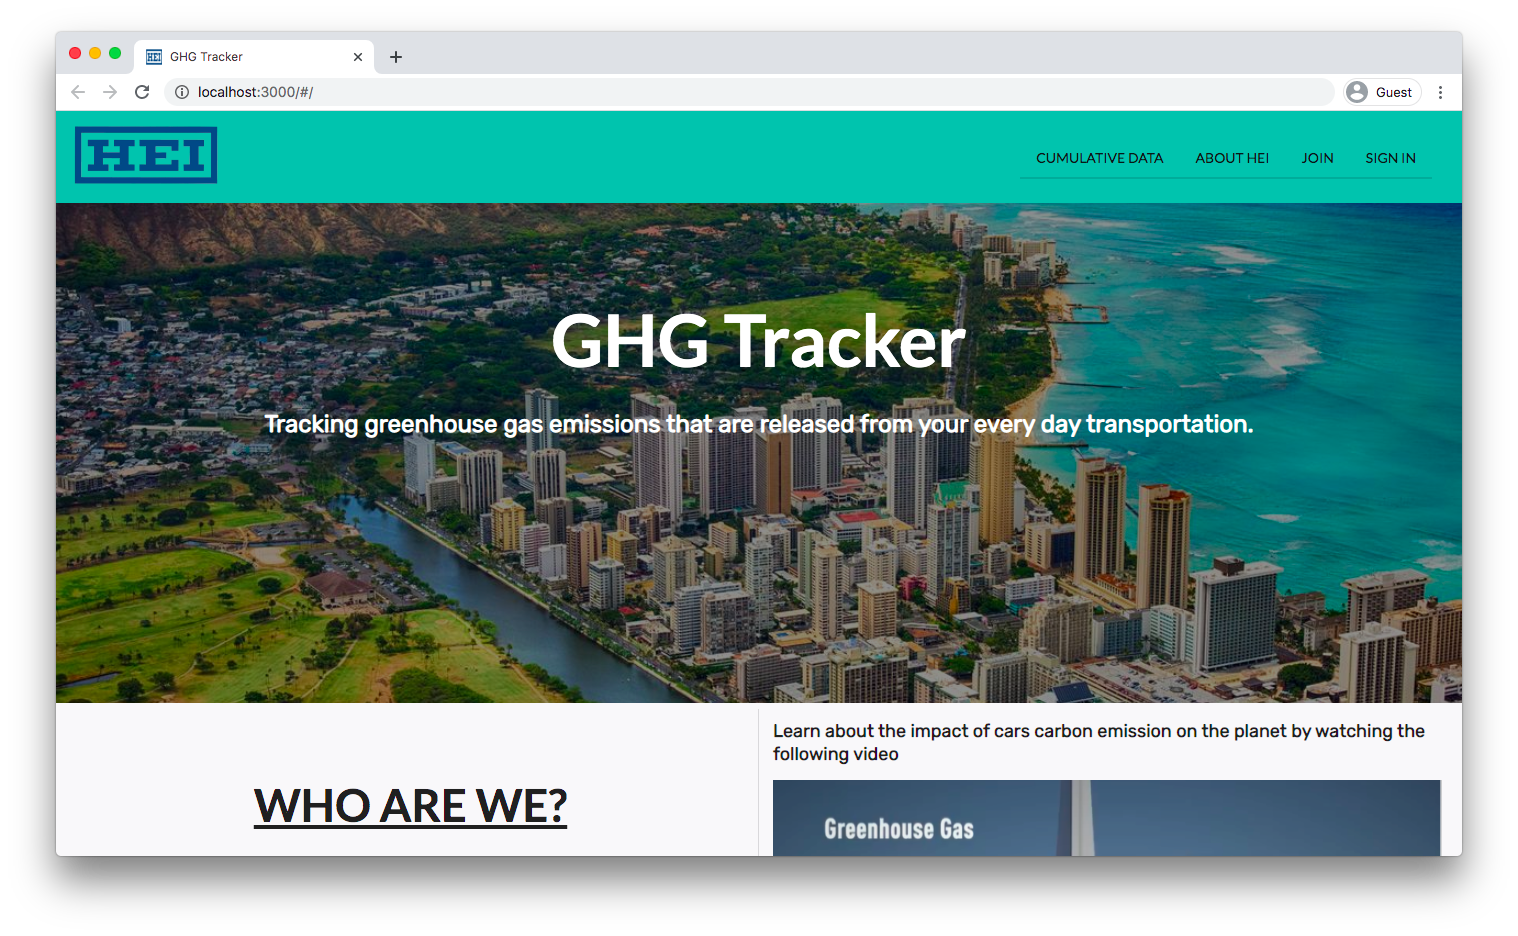
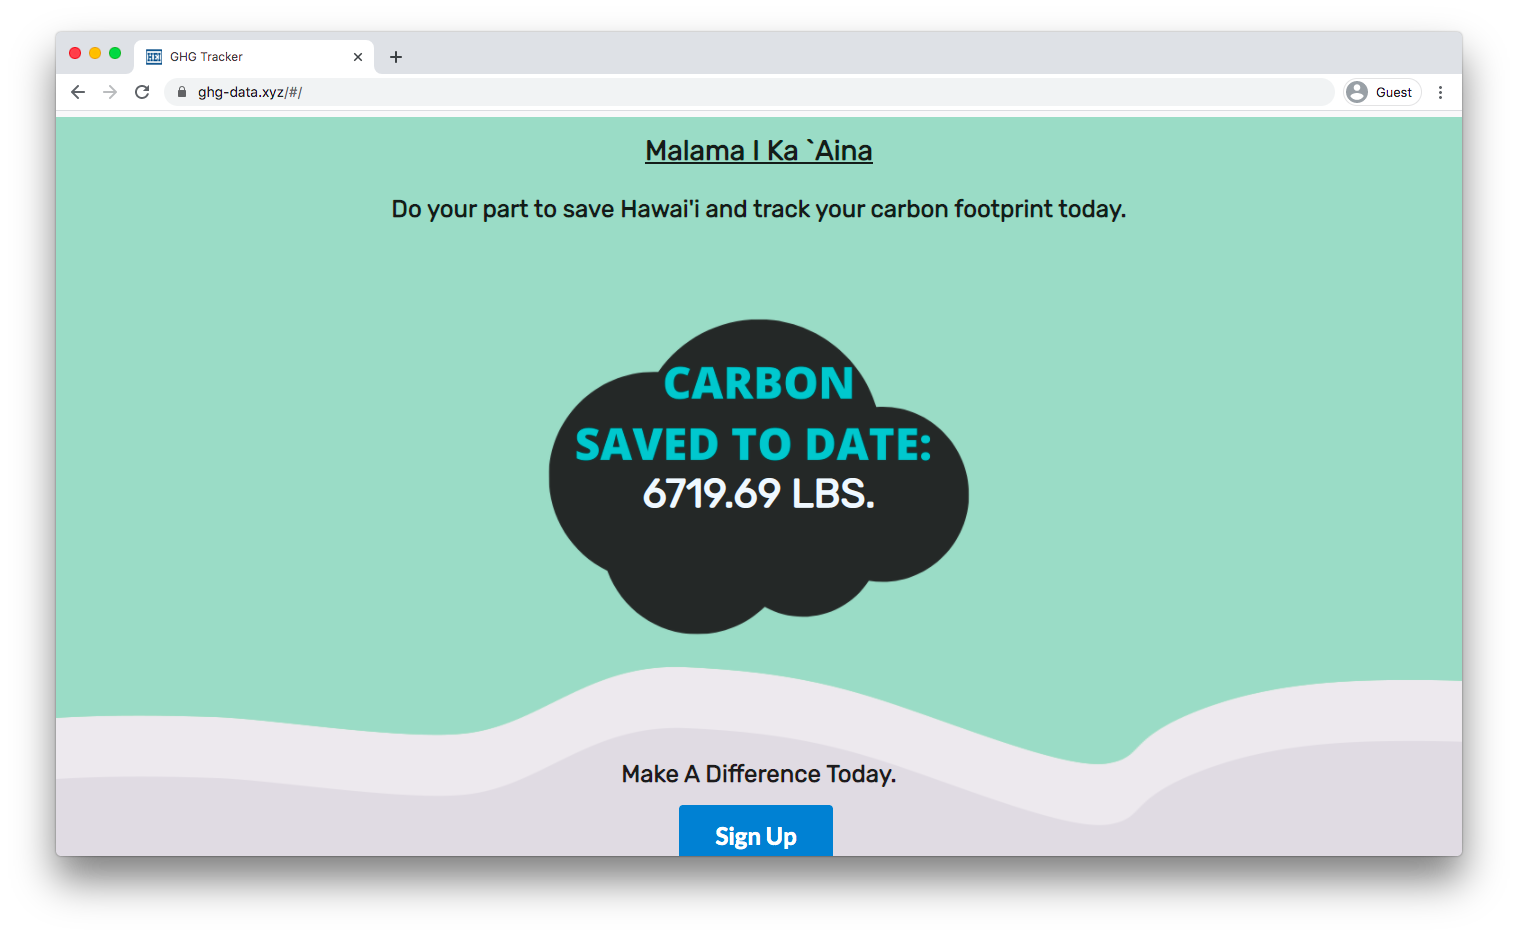
Landing Page
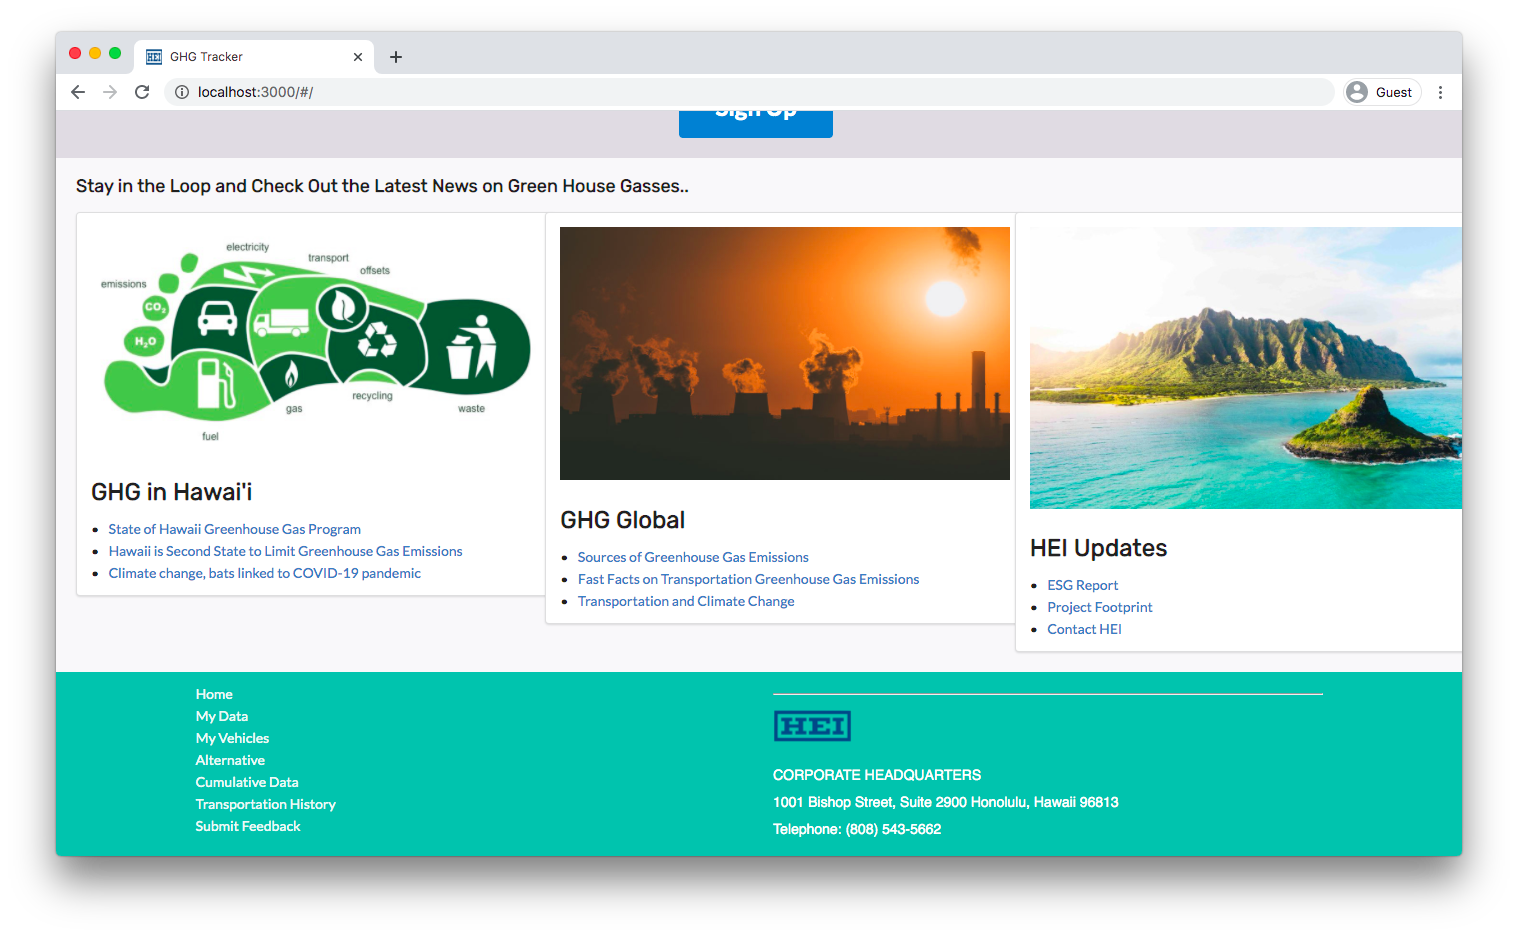
Upon entering the site, the user is greeted by the landing page. This gives the user an overview of what the application is, information regarding greenhouse
gases, and the importance of reducing our emissions through videos, news updates and a visual depicting the carbon saved to date.
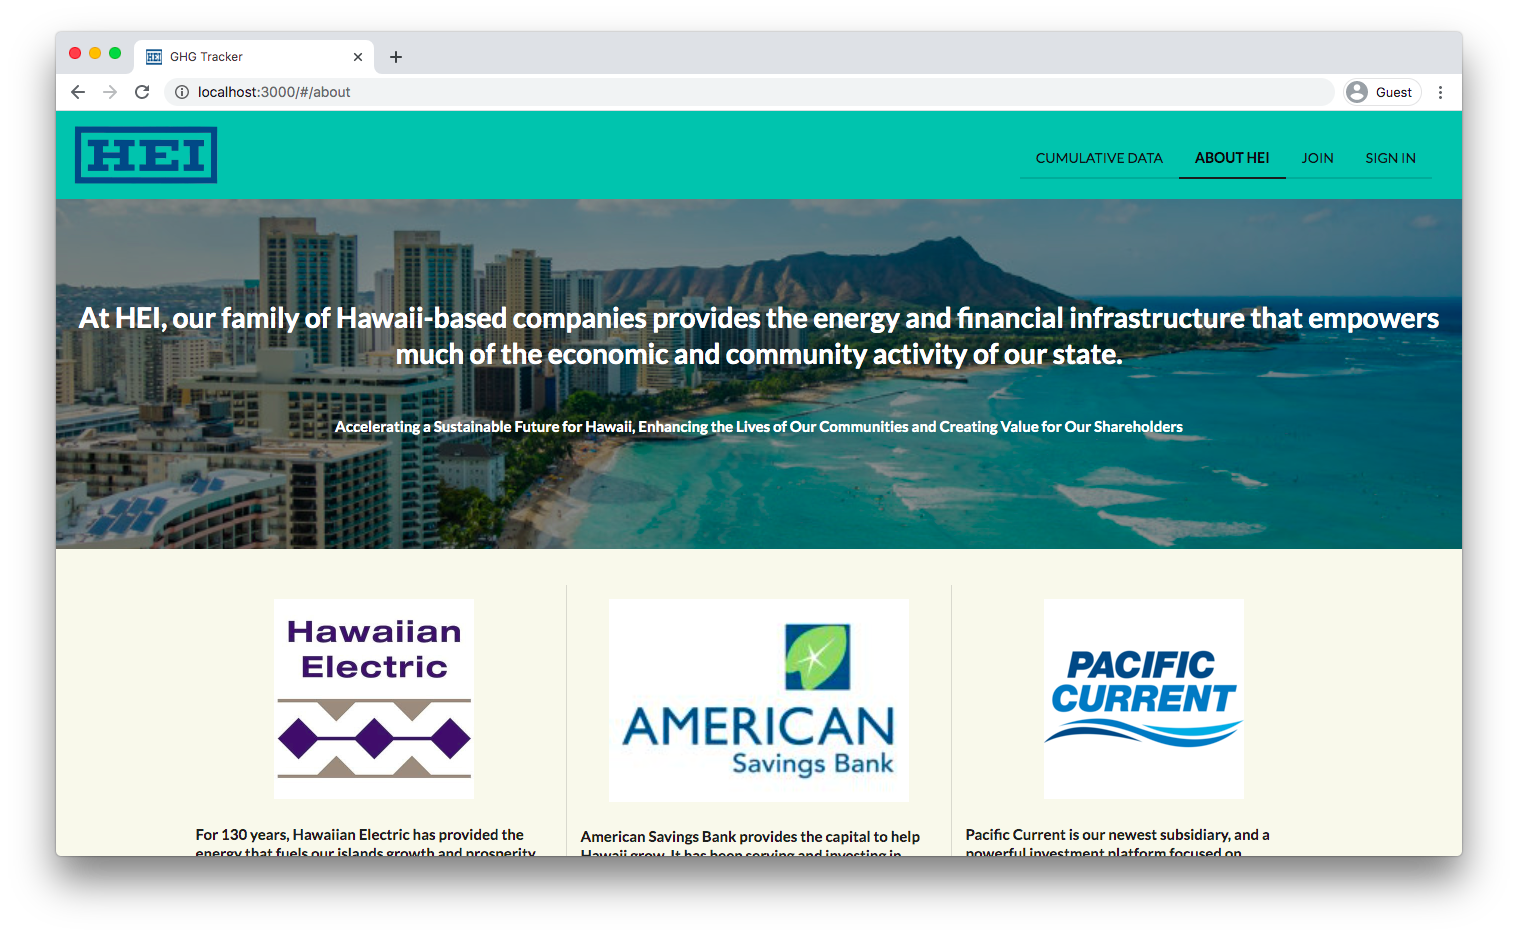
About HEI
A page describing the companies within the HEI sphere.
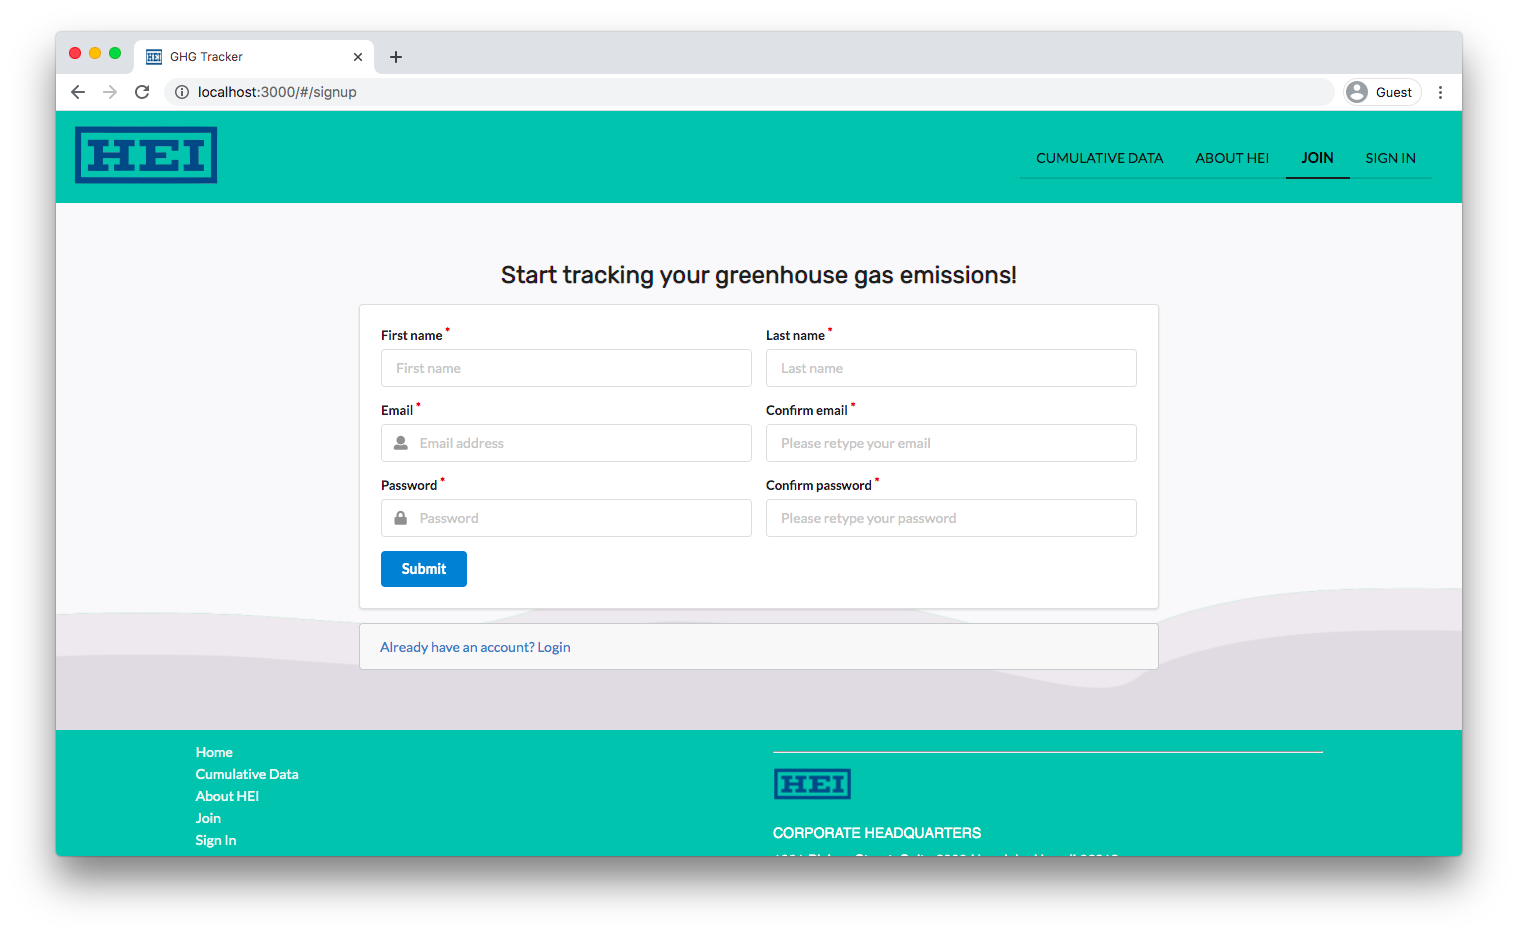
Sign Up
Those who are willing to track their GHG emissions can sign up for an account. Users can fill out the necessary fields to create an account.
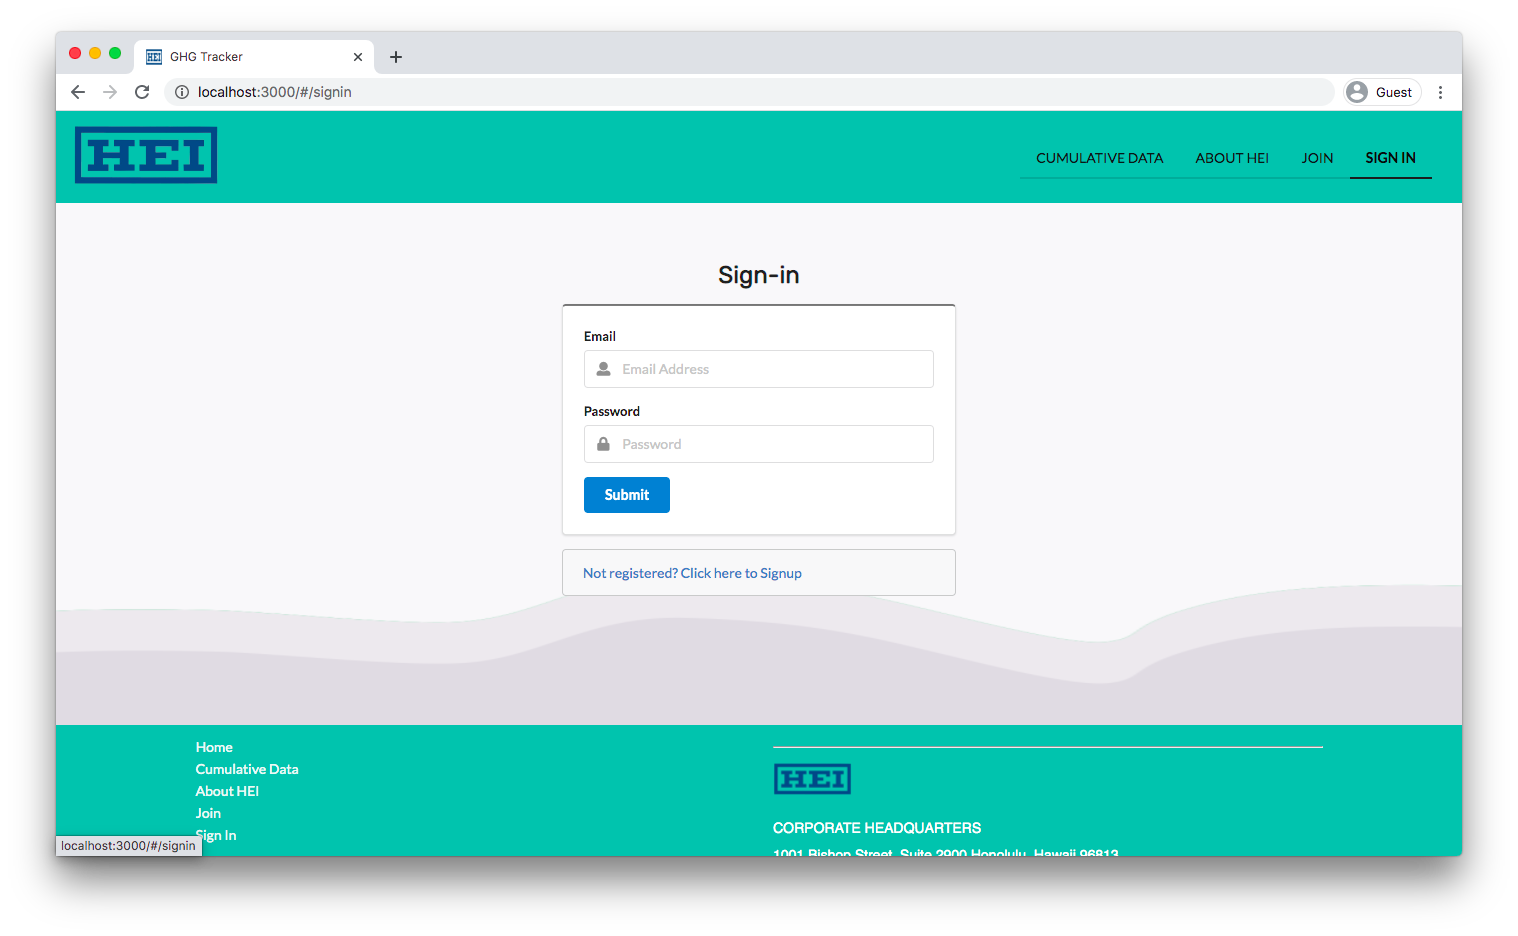
Sign In
Returning user? They can login via the navigation bar, or from the footer.
User Pages - My Data and My Vehicles
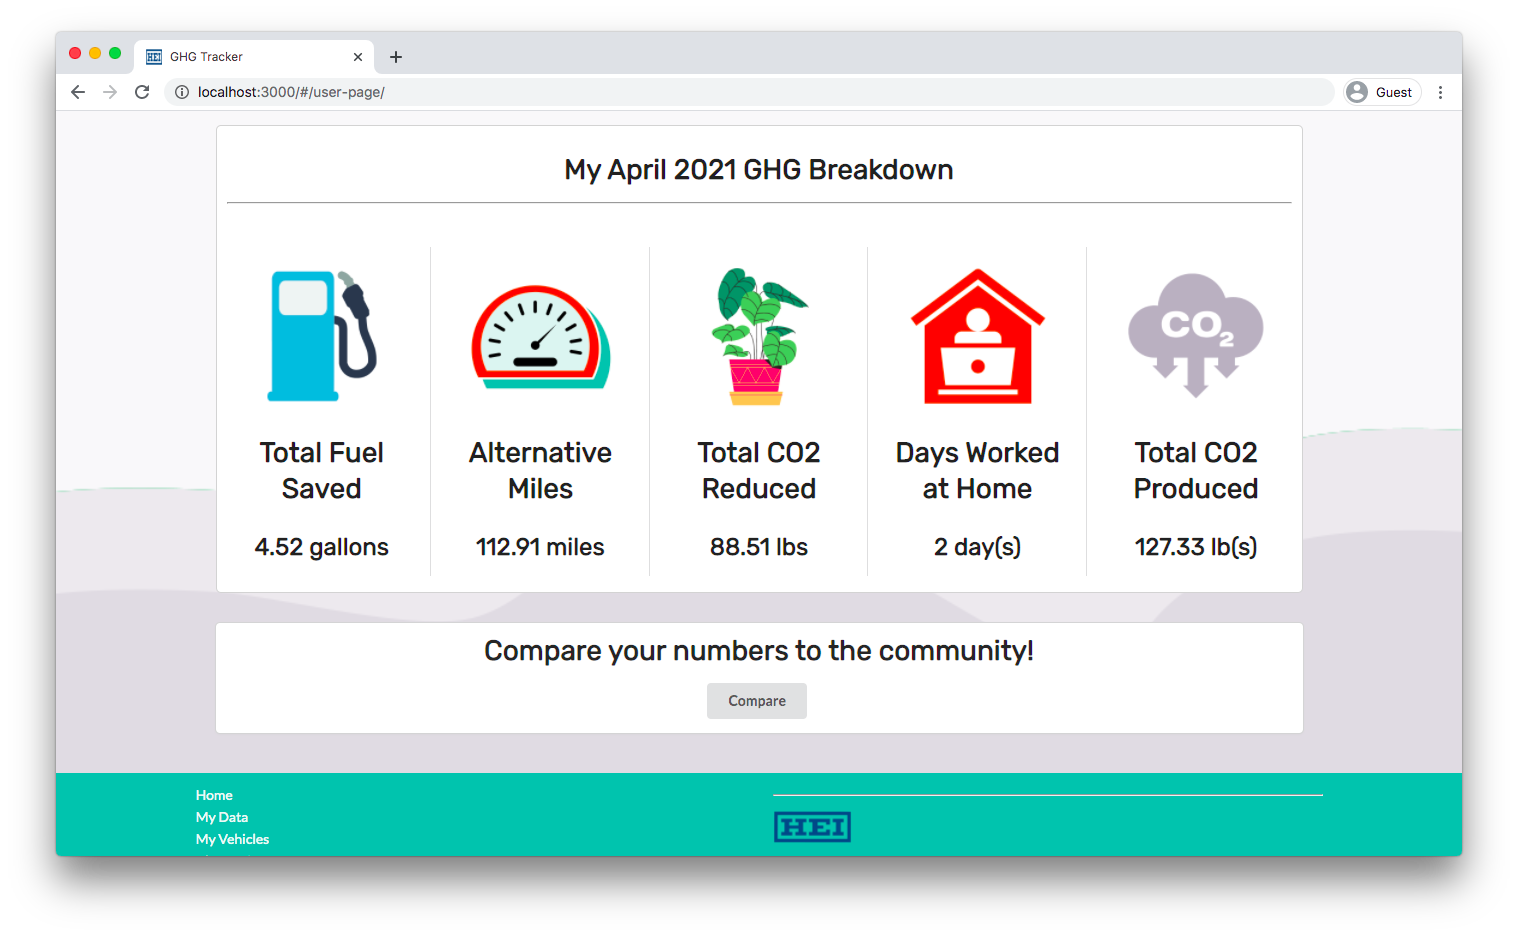
See a breakdown of your GHG numbers by month
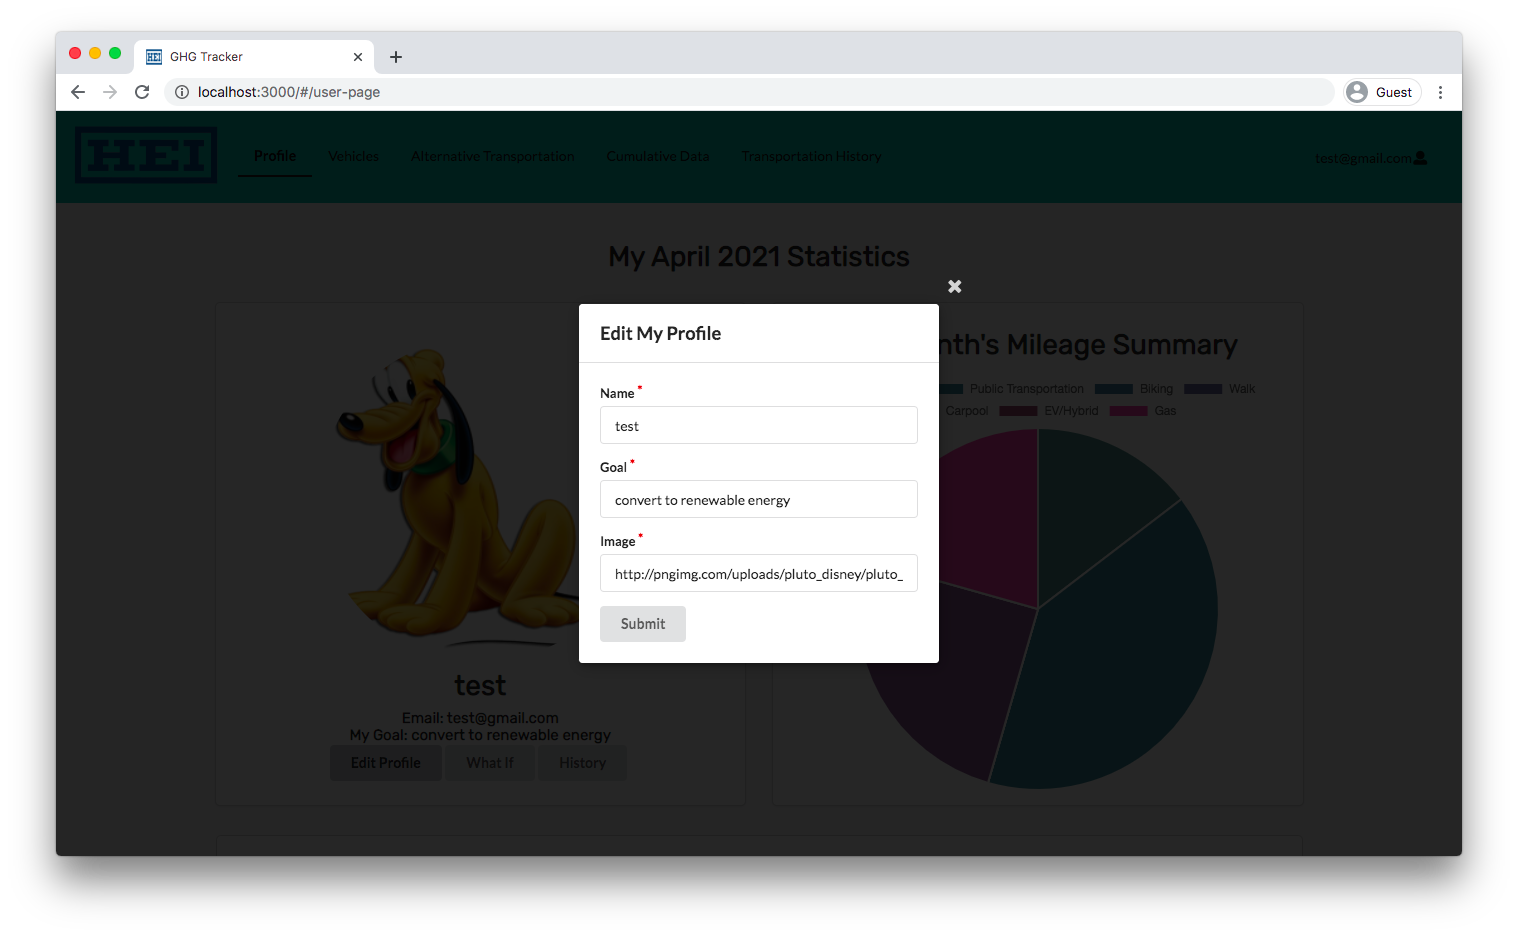
Upon logging in, users are greeted by their data page: an overall breakdown over their GHG emissions for the month. The page includes a profile card with the user’s name and goal, as well as an option to edit their profile, use the what if calculator, or view their transportation history. Users are also able to see a breakdown of their GHG emissions by seeing what mode of transportation they use the most via the mileage breakdown, as well as how much CO2 they produce and reduce, the number of alternative transportation miles they’ve traveled, and for the time being, the days they’ve worked at home.
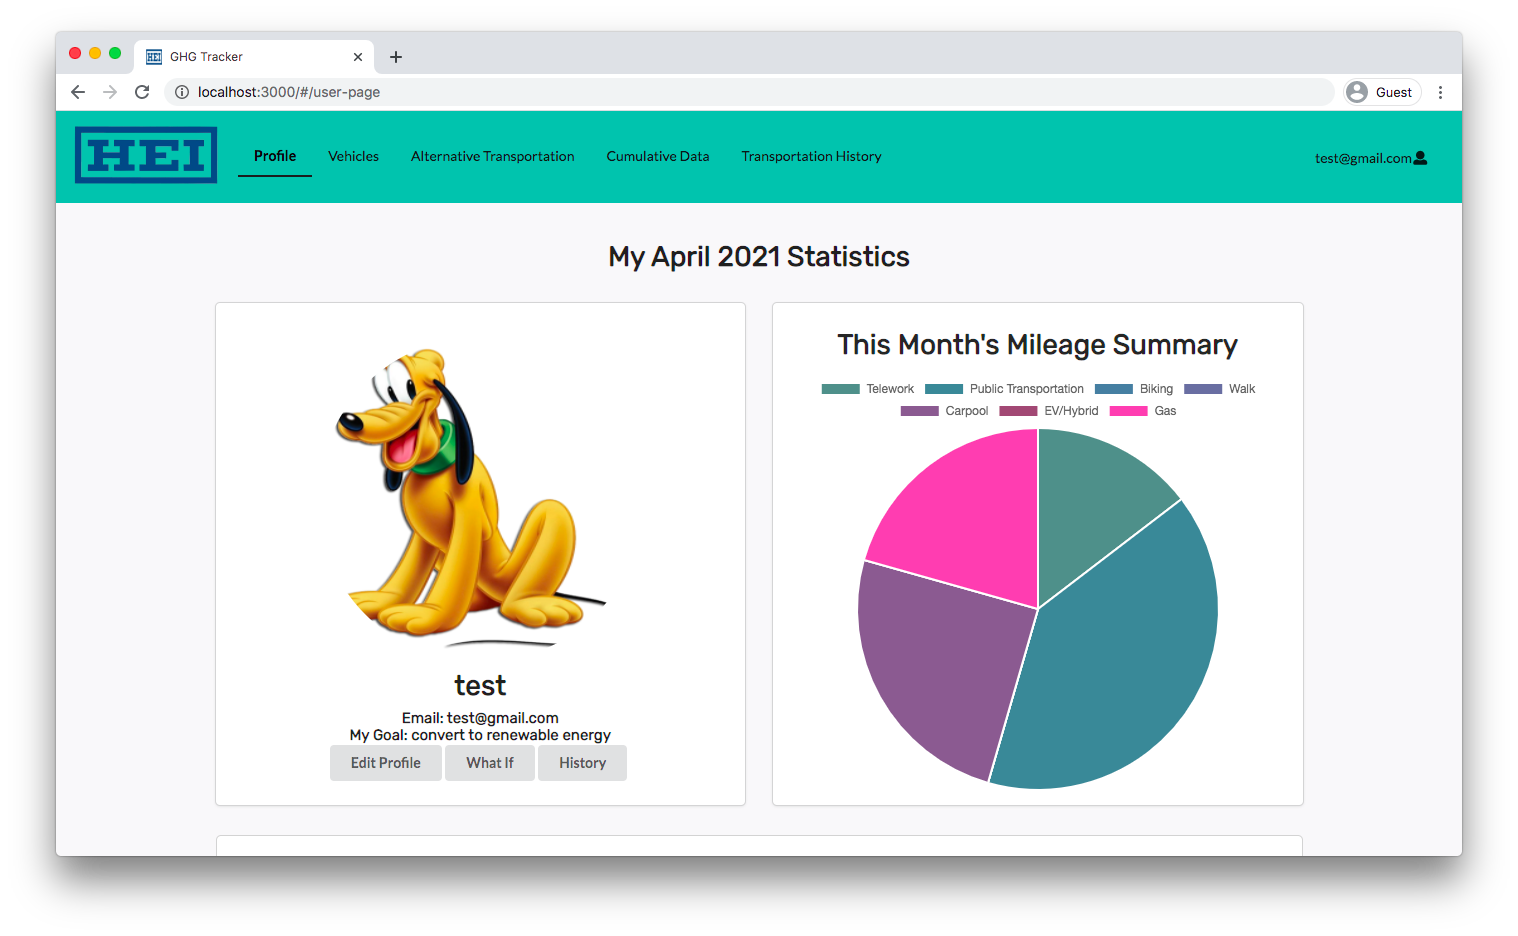
The user’s GHG breakdown for the month:
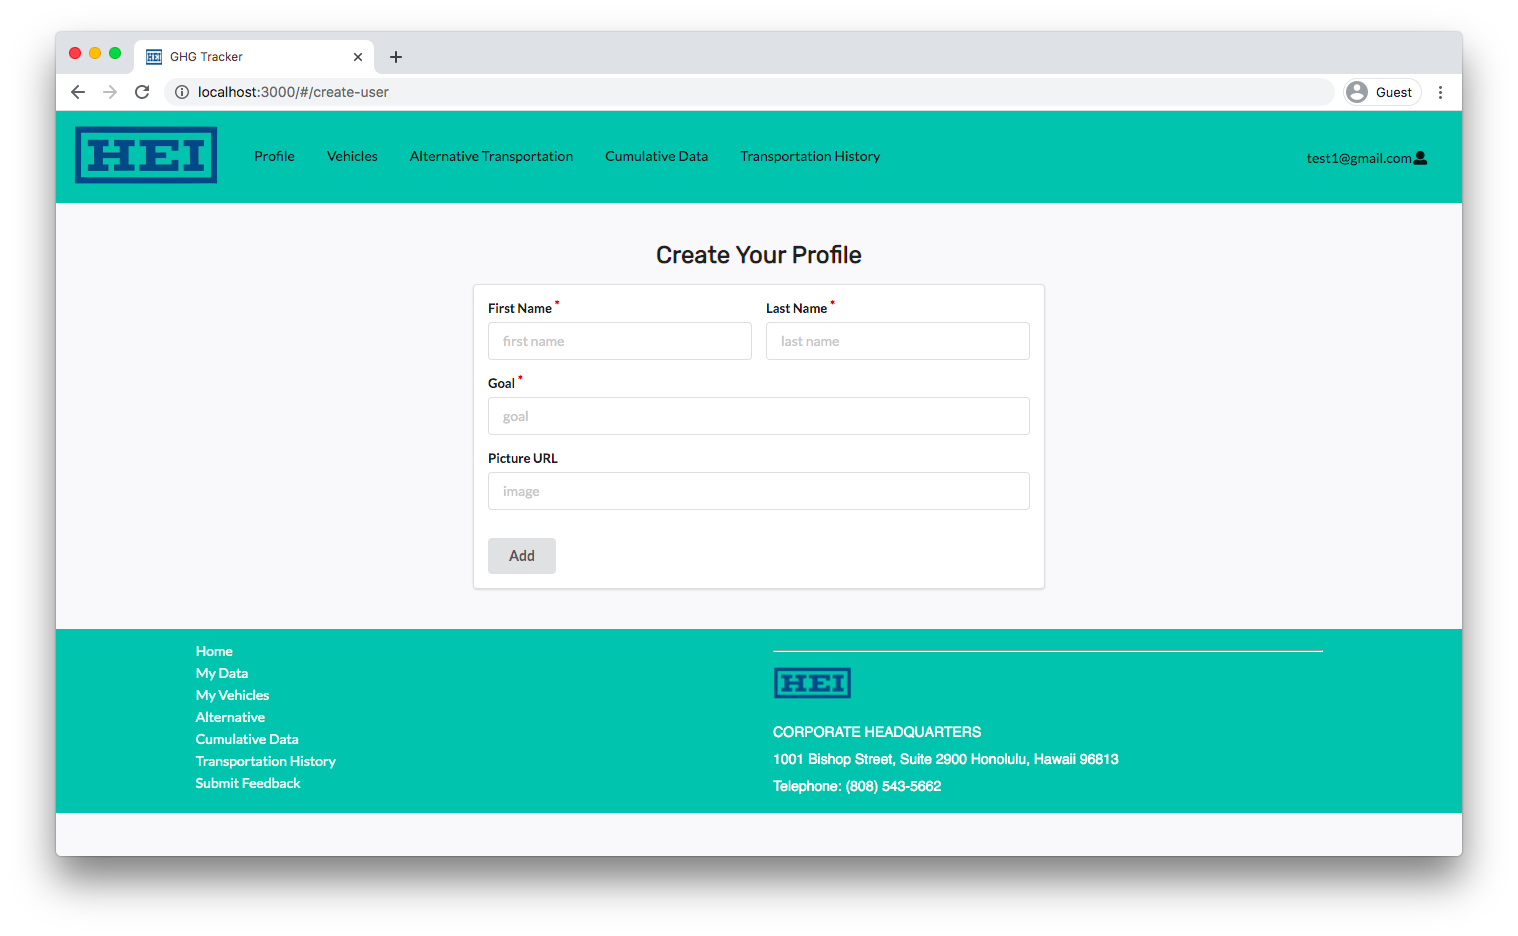
Edit your goal, name or profile picture:
My Transportation History
Users are able to view their all time transportation history. Displayed before them is the date of their trip, the mode of transportation, miles traveled, and the
amount of CO2 reduced and produced for that trip. Similarly, users can add, edit, and delete their trip entries, as well as perform a what if calculation to
encourage them to pursue a form of alternative transportation.
![]()
To aid users, the add function has saved trip data for work and other places that the user may frequently travel to through specifying their destination.
![]()
Otherwise, the user may enter the data manually through the Other option. Users can specify if the trip is a roundtrip, as well as the distance traveled in either miles or kilometers.
![]()
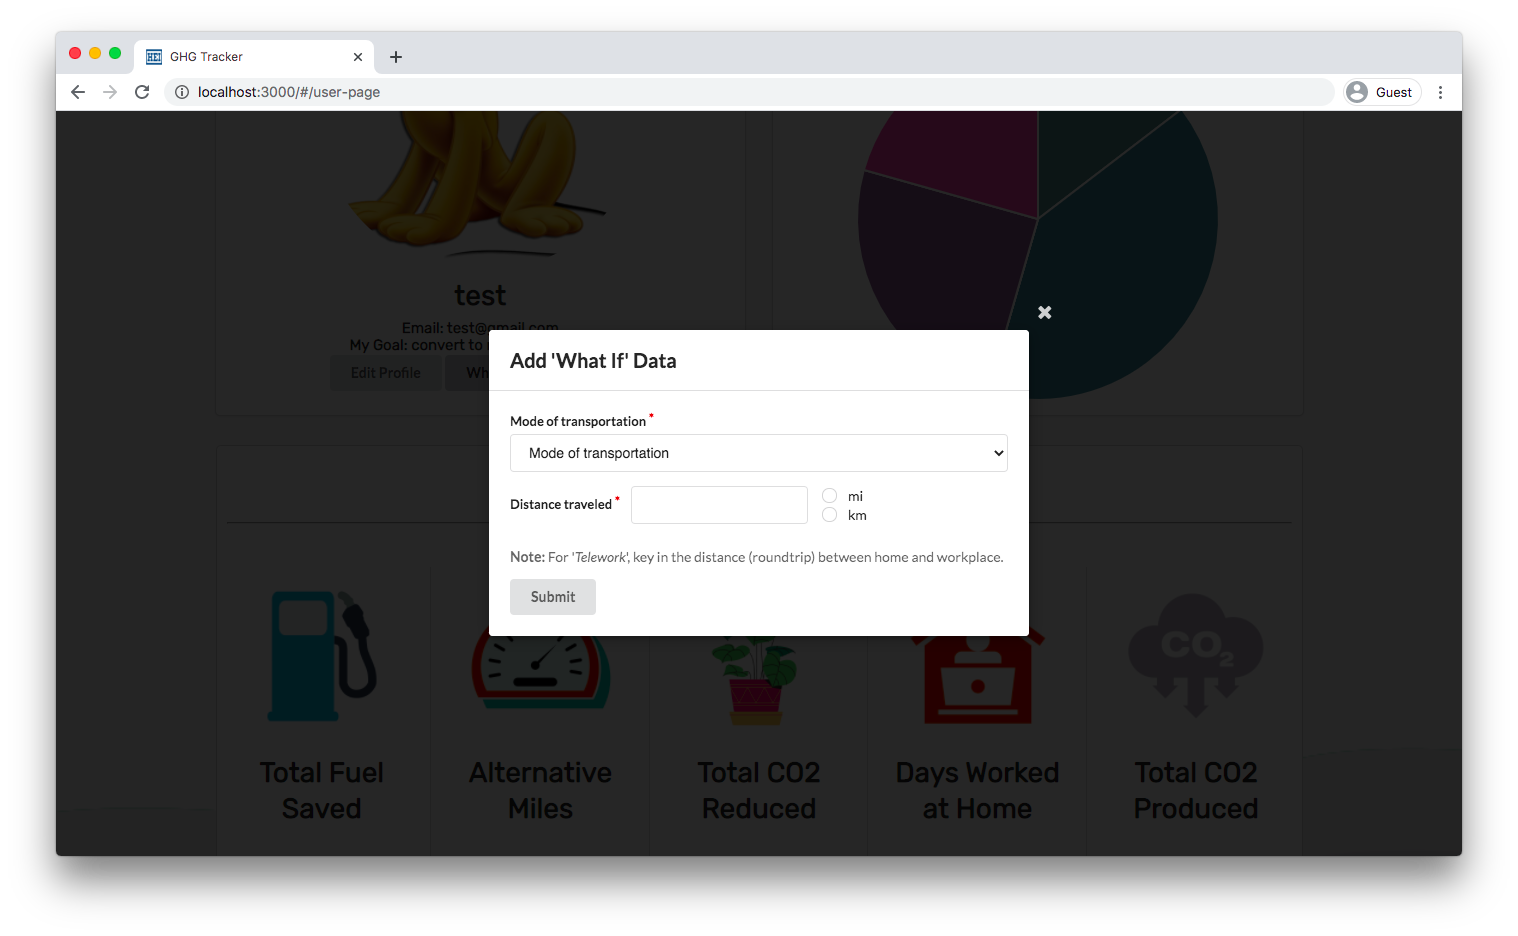
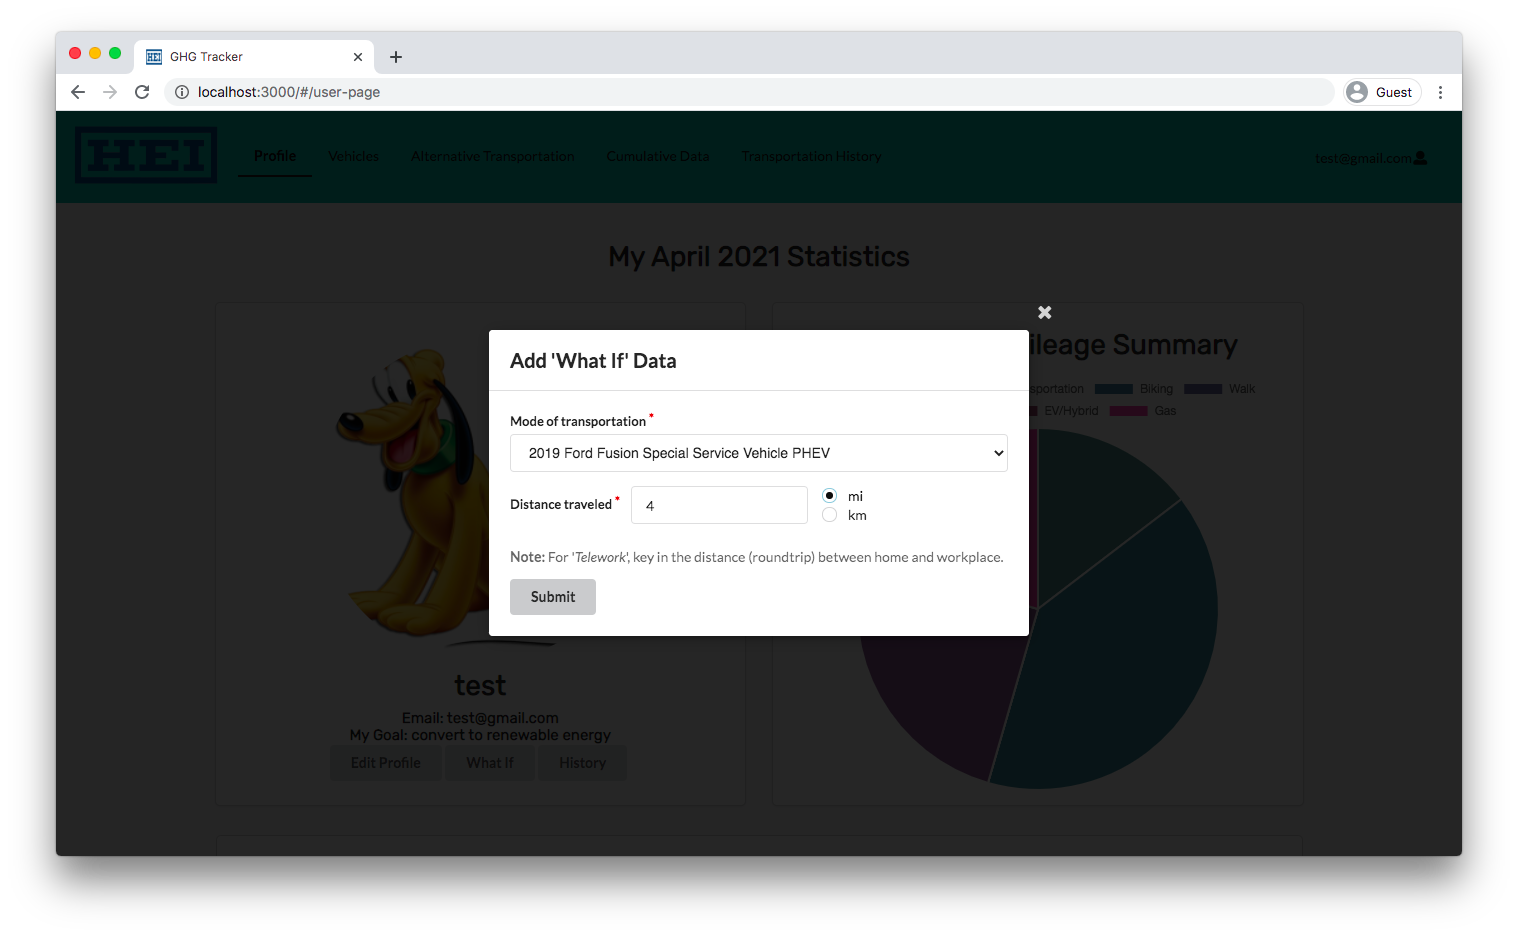
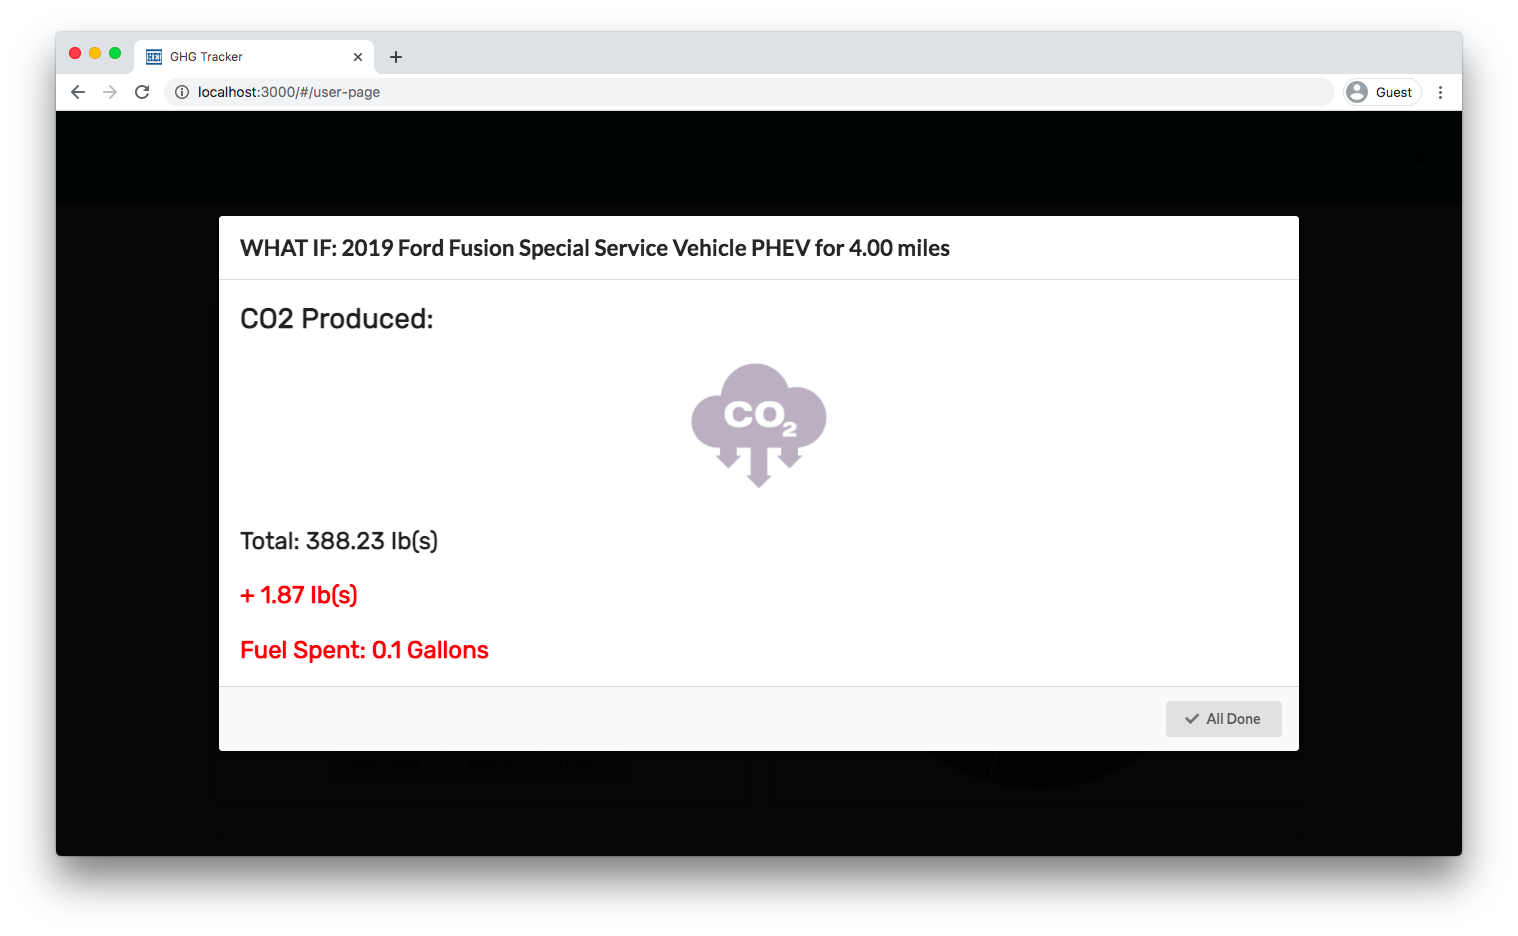
What If
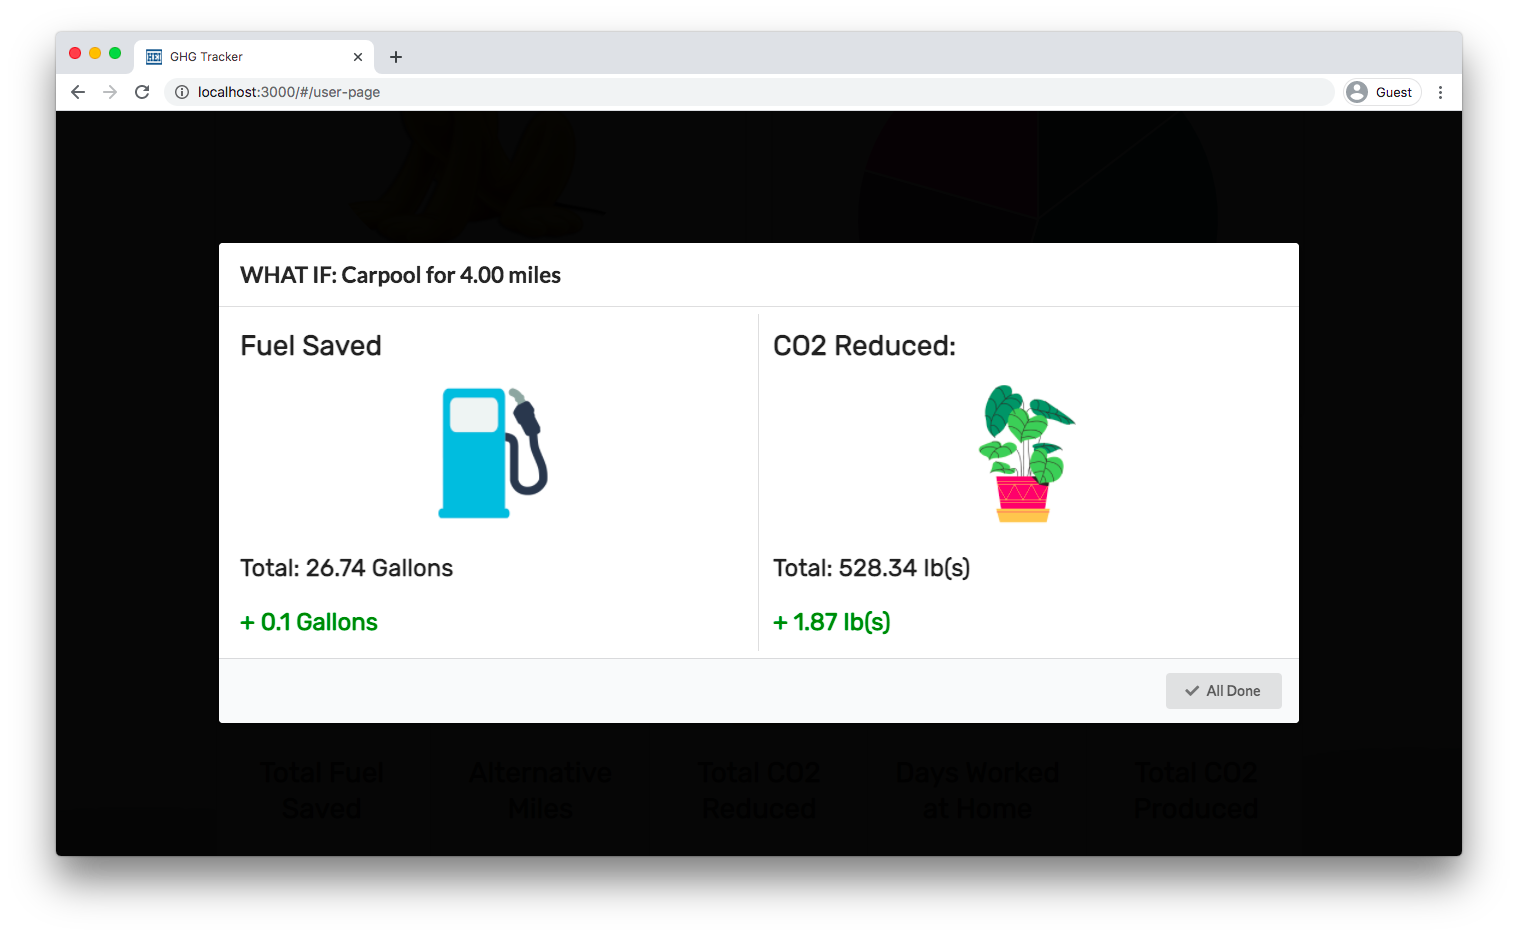
Not convinced of the benefits of alternative transportation? The what if function allows users to calculate their GHG numbers before they make their trip. Users can input their planned travel details by inputting a mode of transportation as well as the distance traveled for their trip. Accessible in both miles and kilometers.
What if with a user’s gas vehicle:
Considering a mode of alternative transportation:
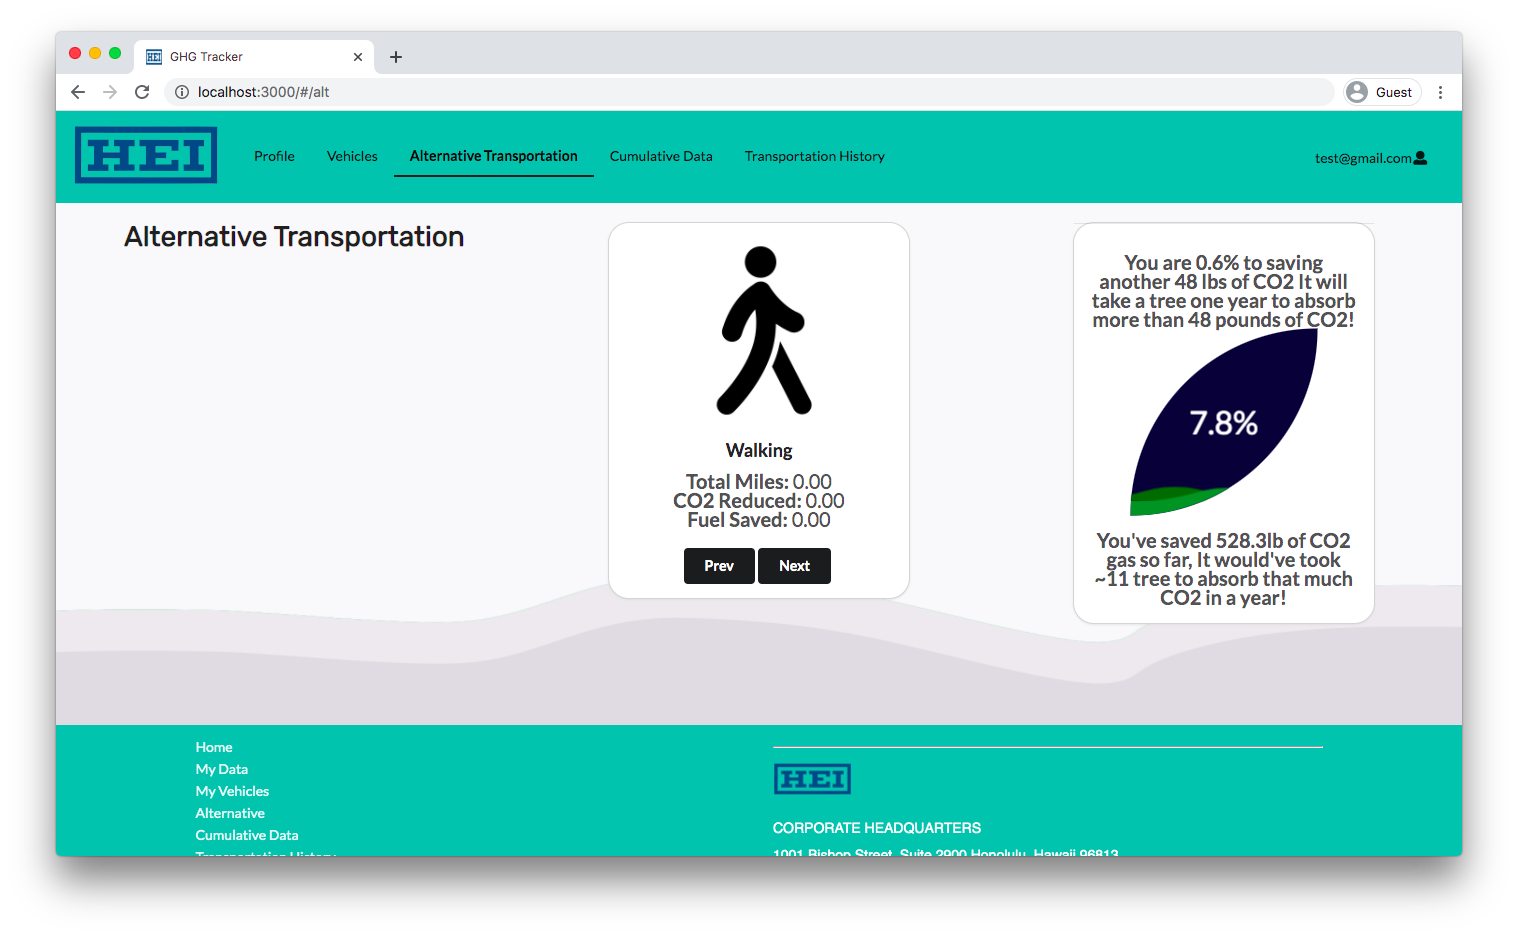
My Overall Transportation Breakdown
Users can see their all time breakdown of the miles traveled, fuel saved and CO2 reduced for their alternative modes of transportation. Similarly, they can view a leaf widget that displays the amount of CO2 that the user has saved, and their numbers in terms of trees: i.e. number of trees to absorb that amount of CO2 gas.
Compare your data against the HEI Community!
Want to see where you stand in comparison to the HEI community? The application allows you to compare your CO2 produced and reduced against the average calculated
from the HEI community for the current month. Similarly, a message is displayed to the user to either commend their efforts if their CO2 reduced is greater than
the amount of CO2 that they have produced, or encourage them to consider their transportation choices if it is the other way around.
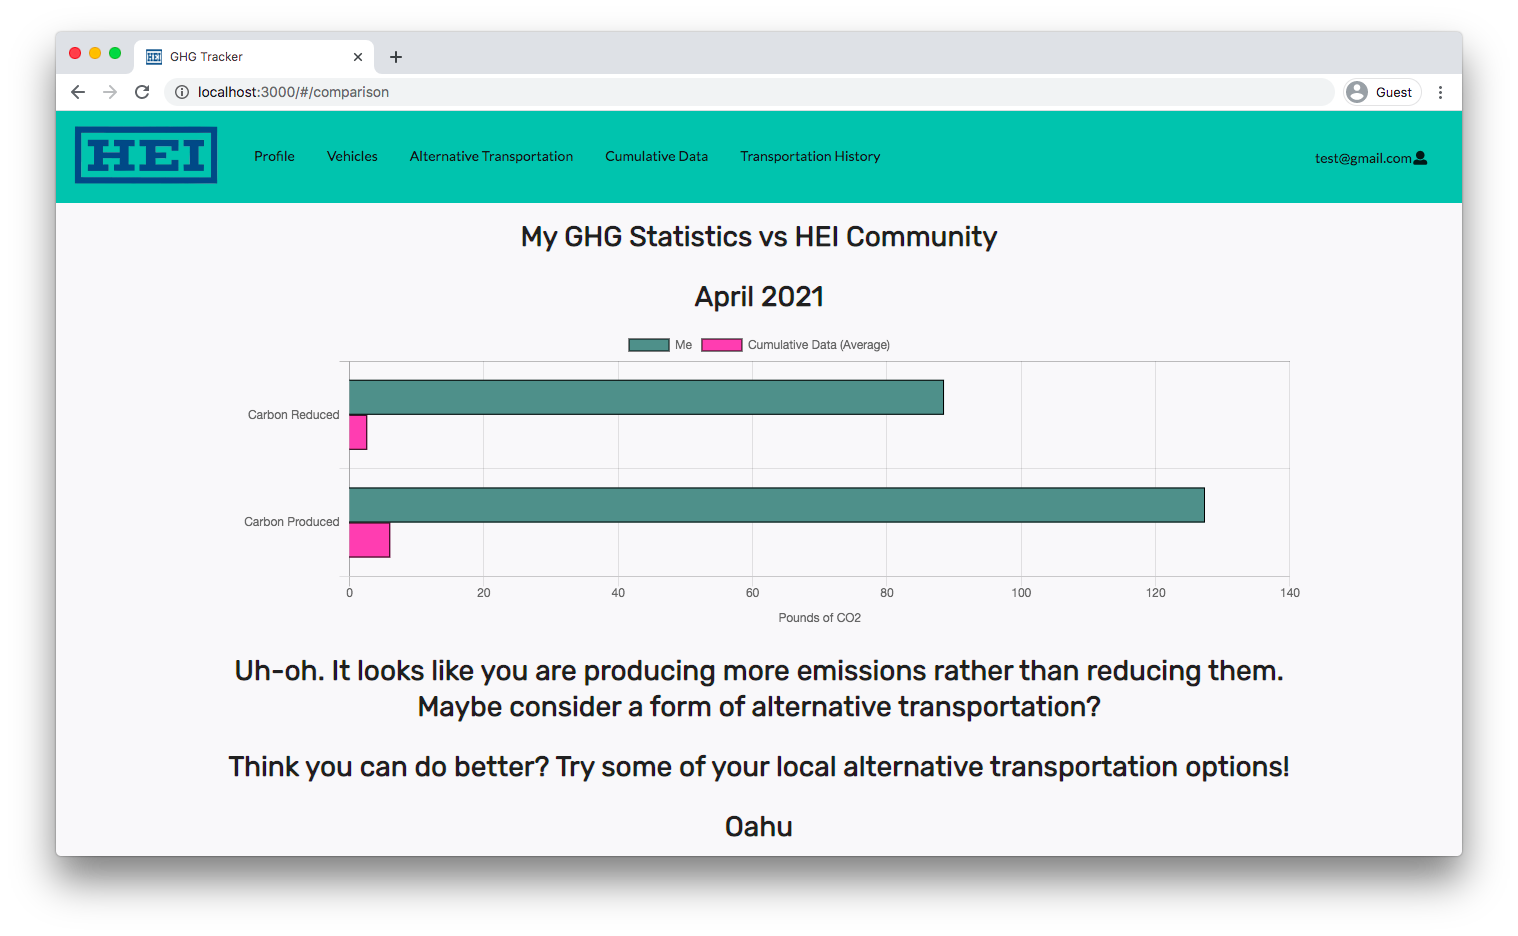
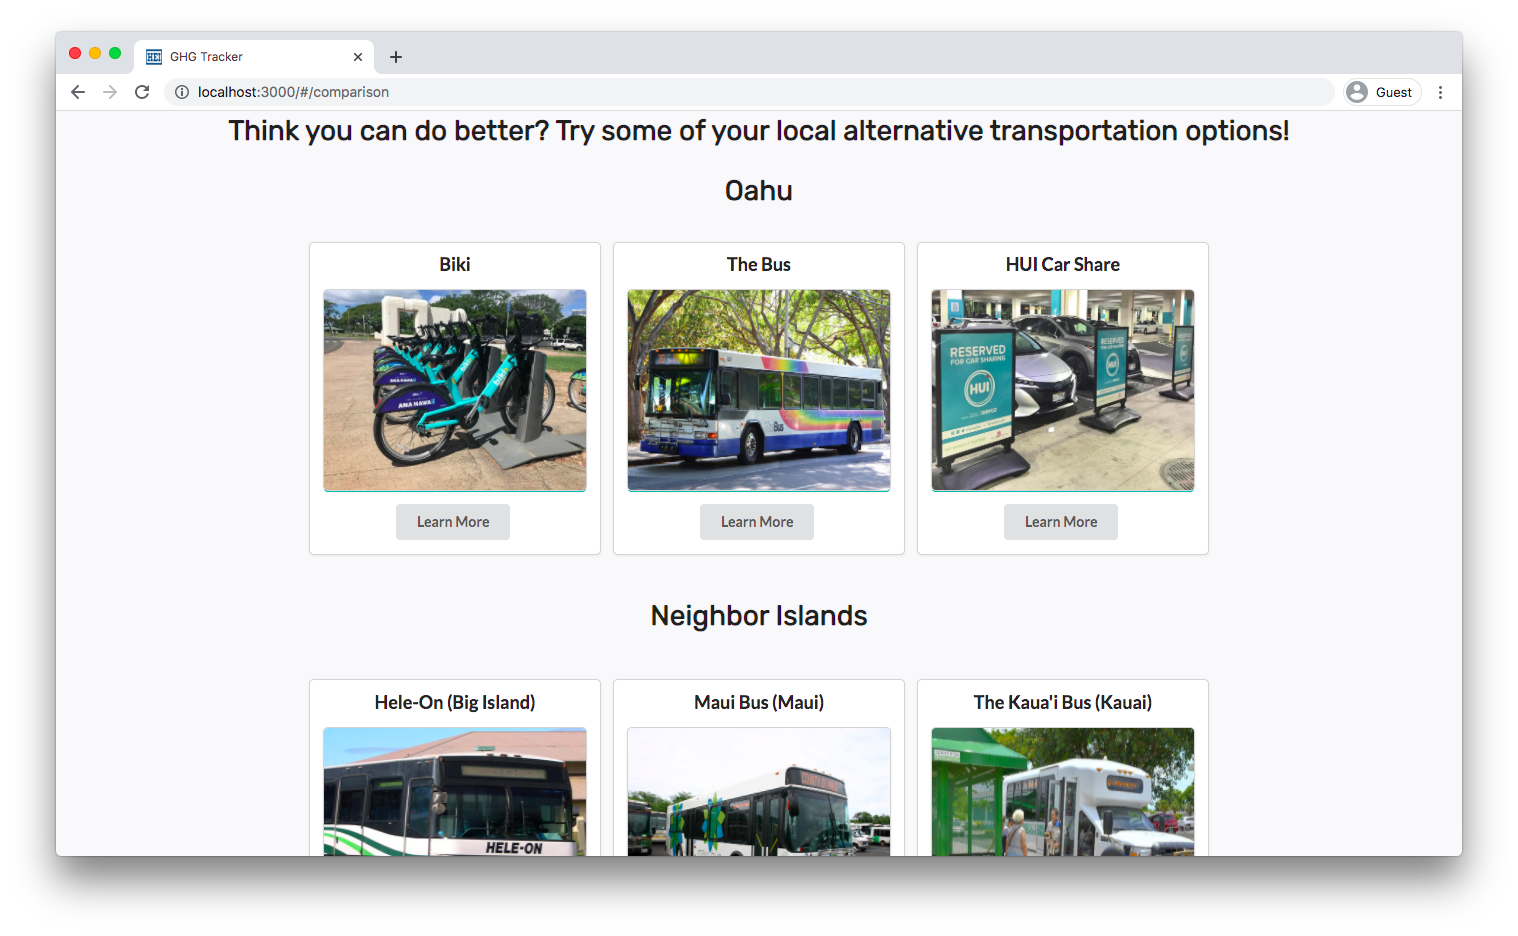
Regardless of one’s CO2 efforts, the page also offers users modes of alternative transportation available to them across the state.
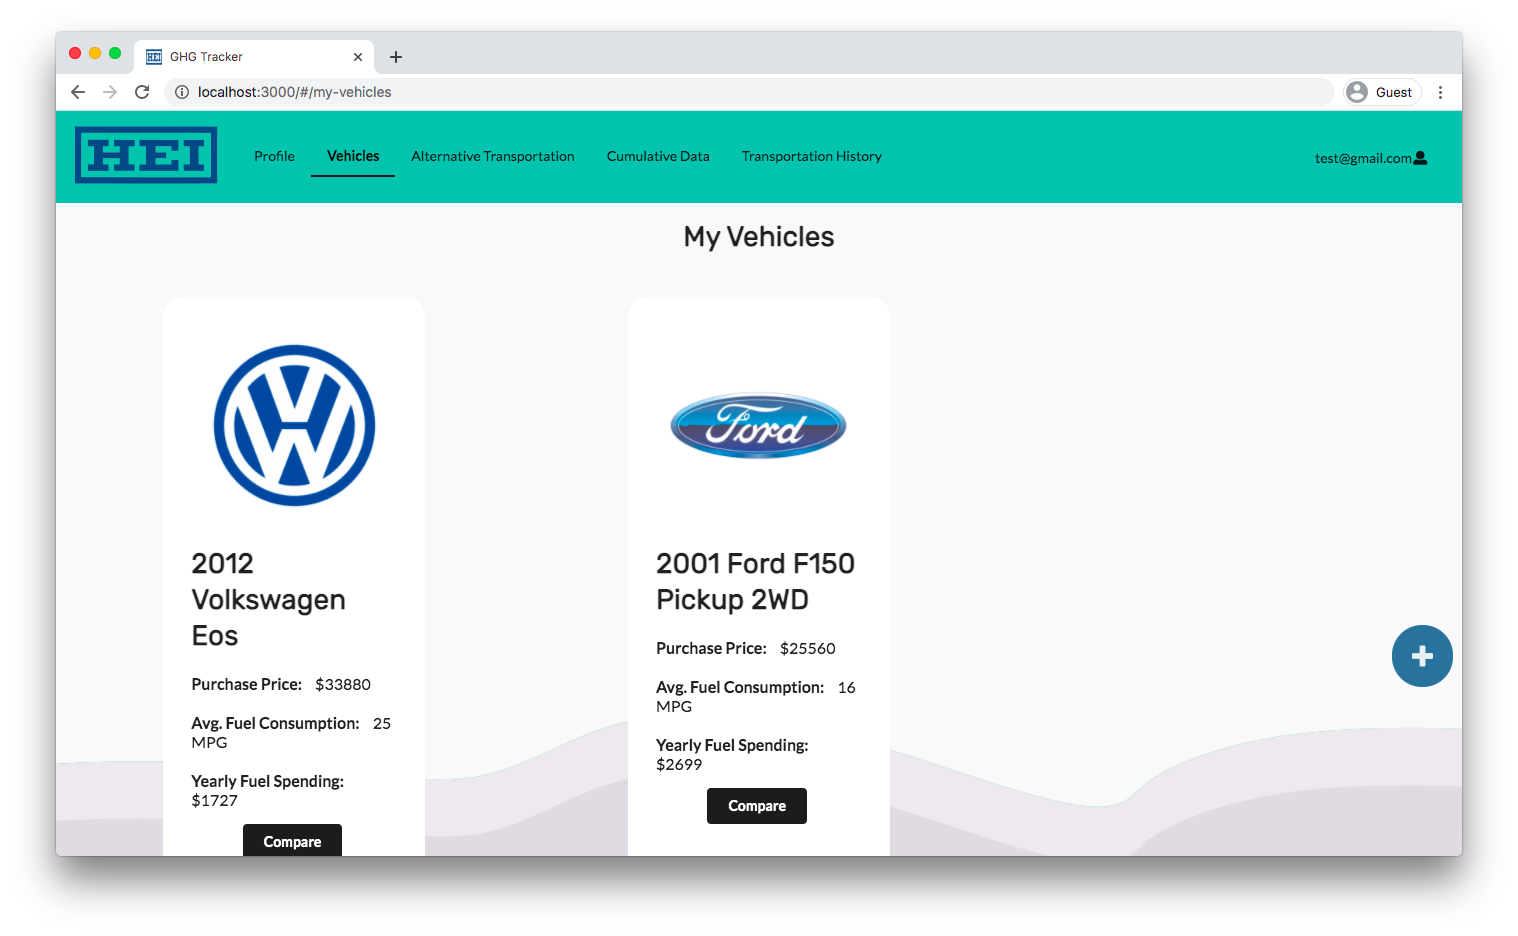
My Vehicles
Users can view the vehicles that they own as well as a short summary of each of their vehicles.
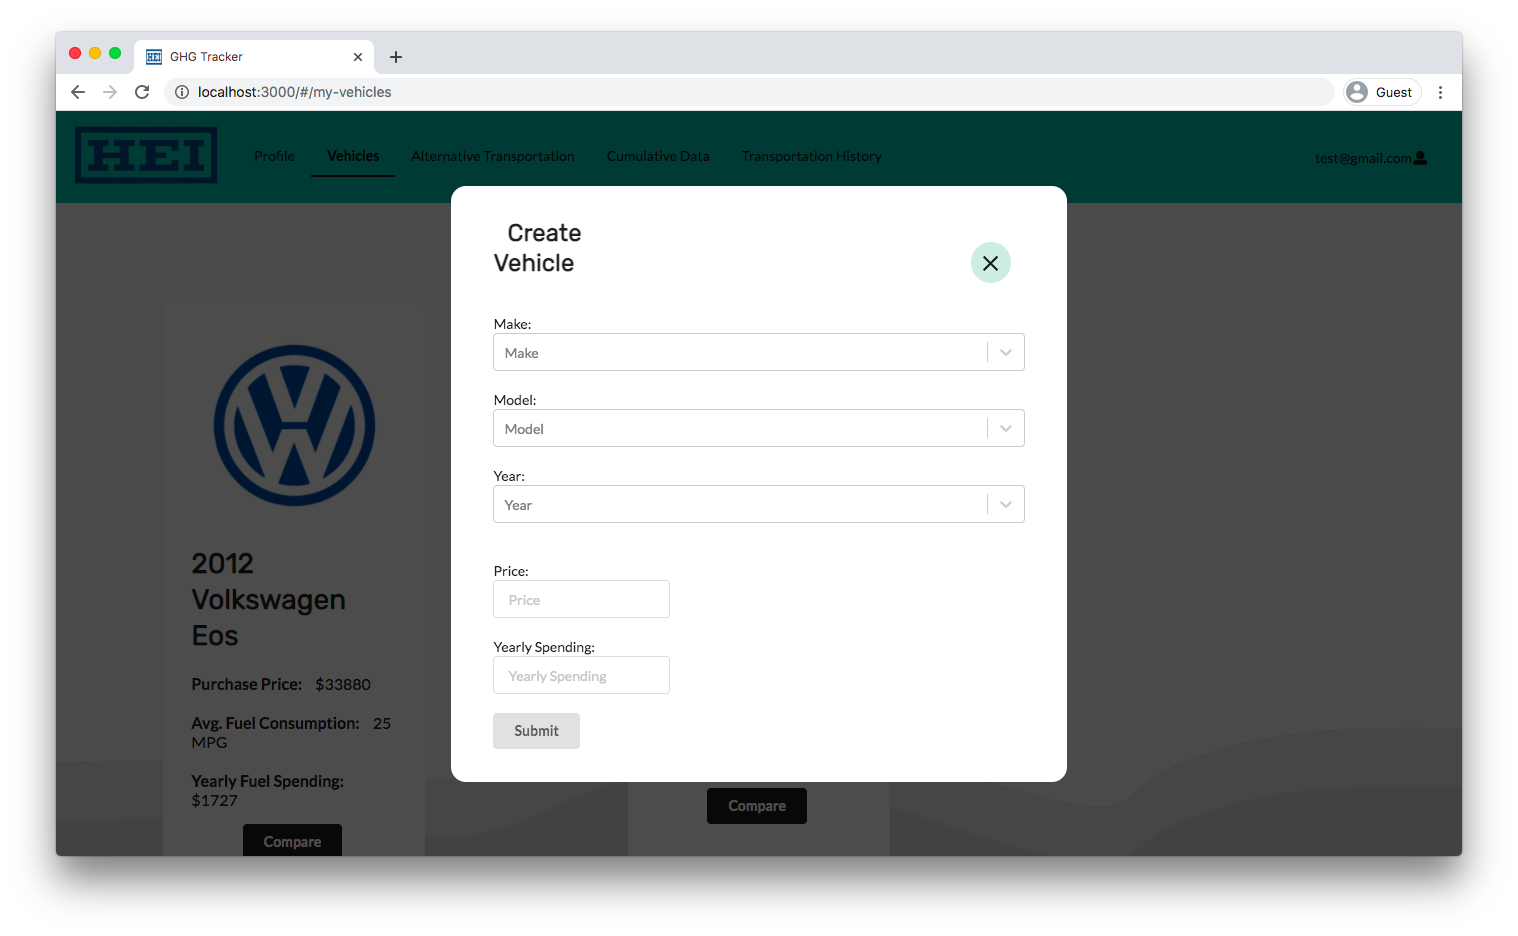
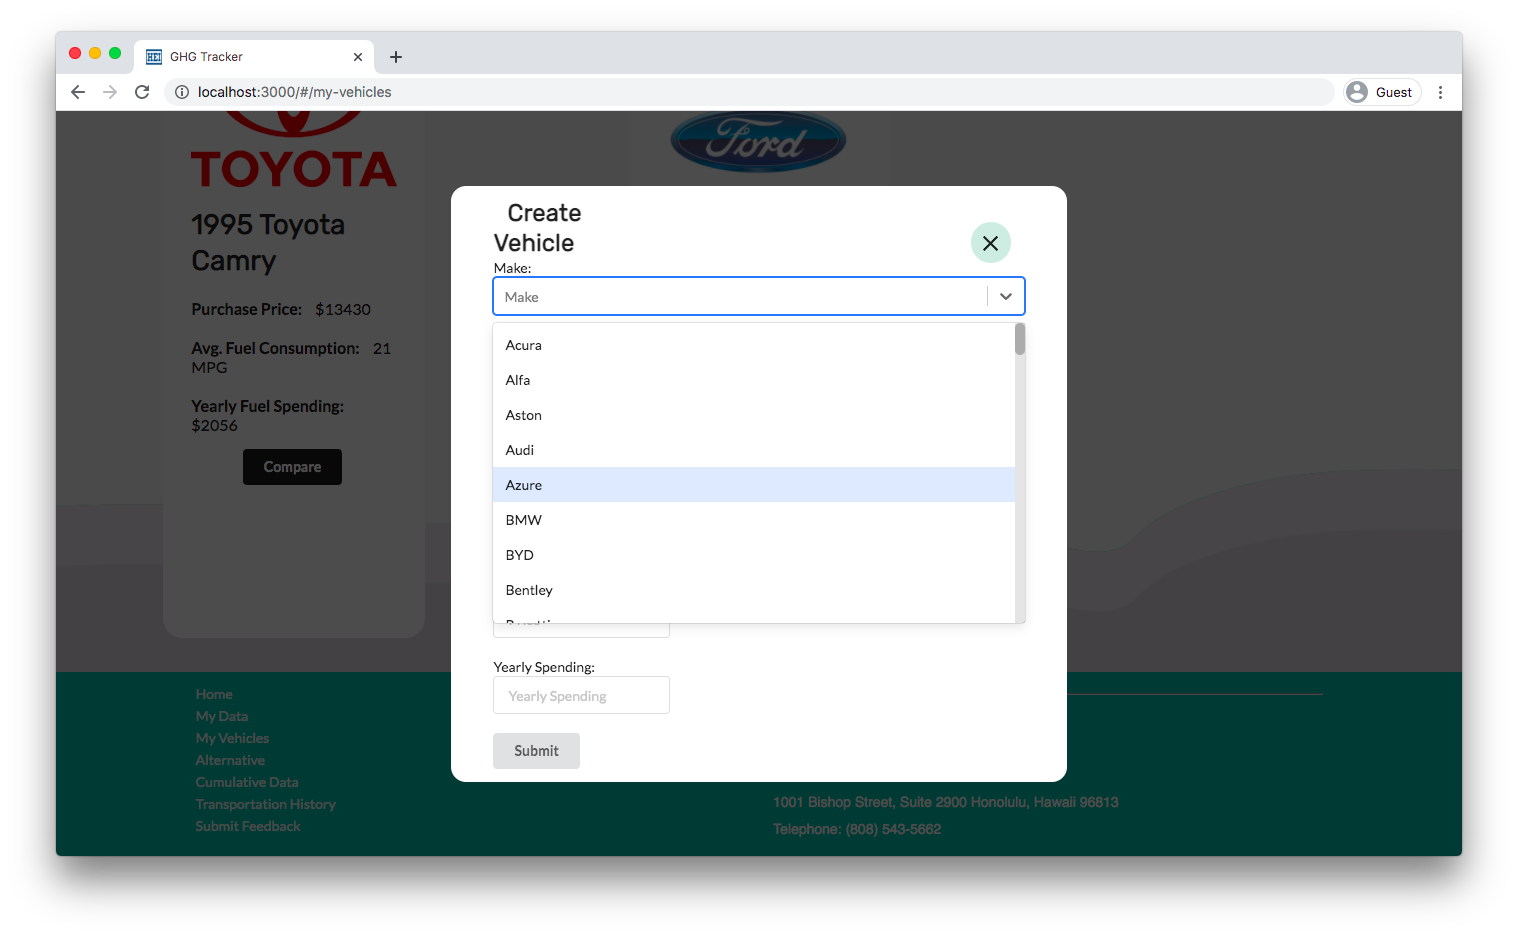
Users may also add their vehicles to their account to be factored into their travel data by searching through the various makes for their vehicle. Search for the make and model of your car in our database!
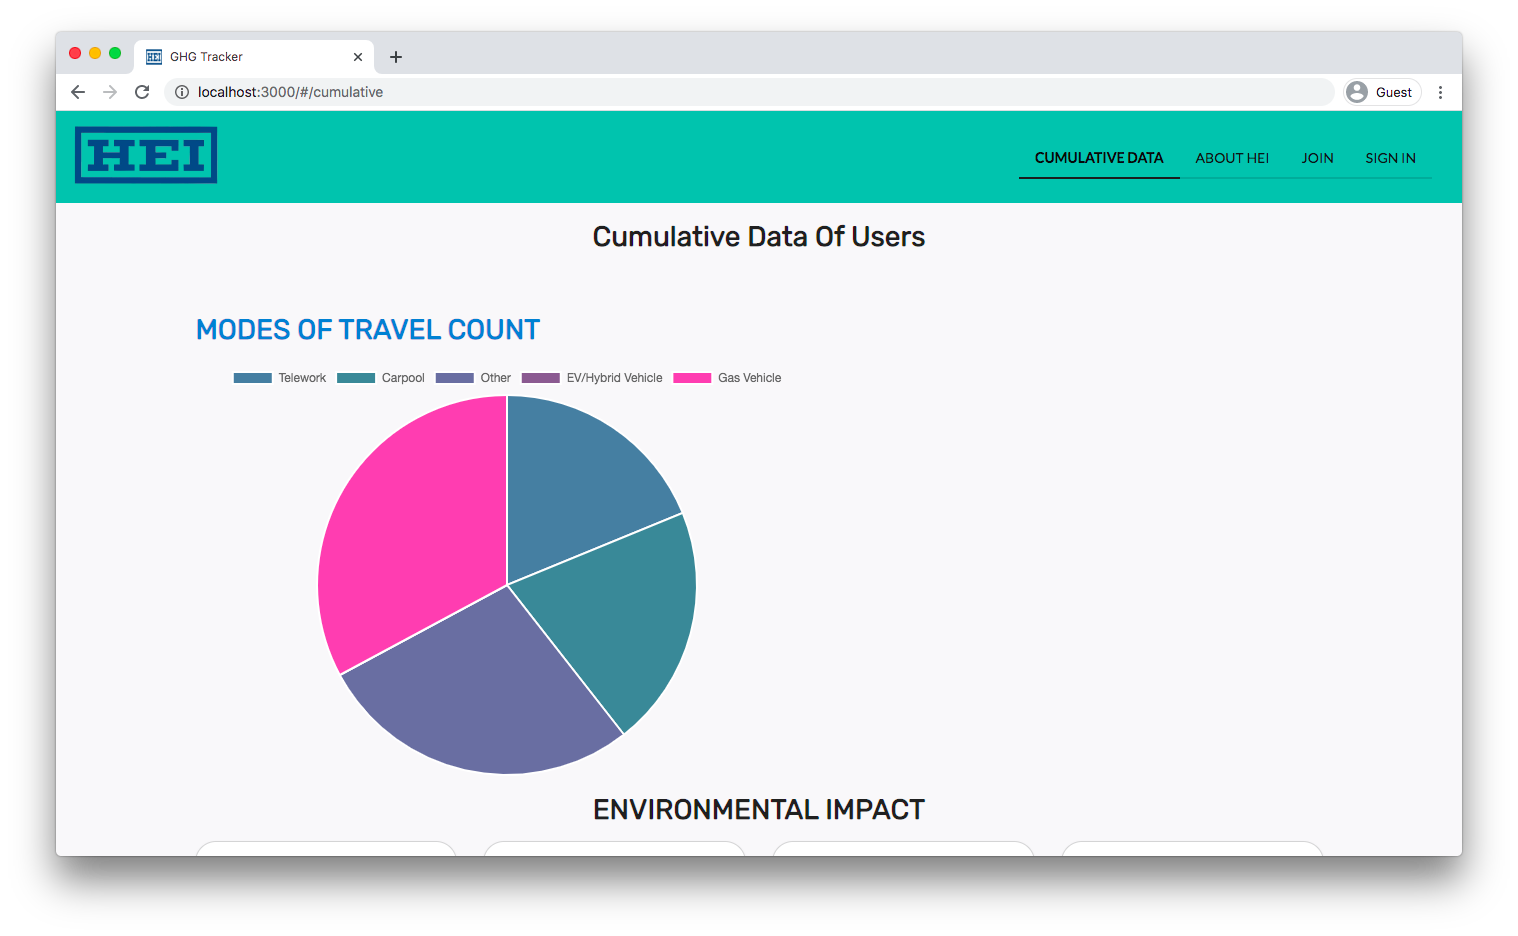
Cumulative Data
Users may view the cumulative data of the HEI community. They are able to view the number of users that use a certain form of transportation:
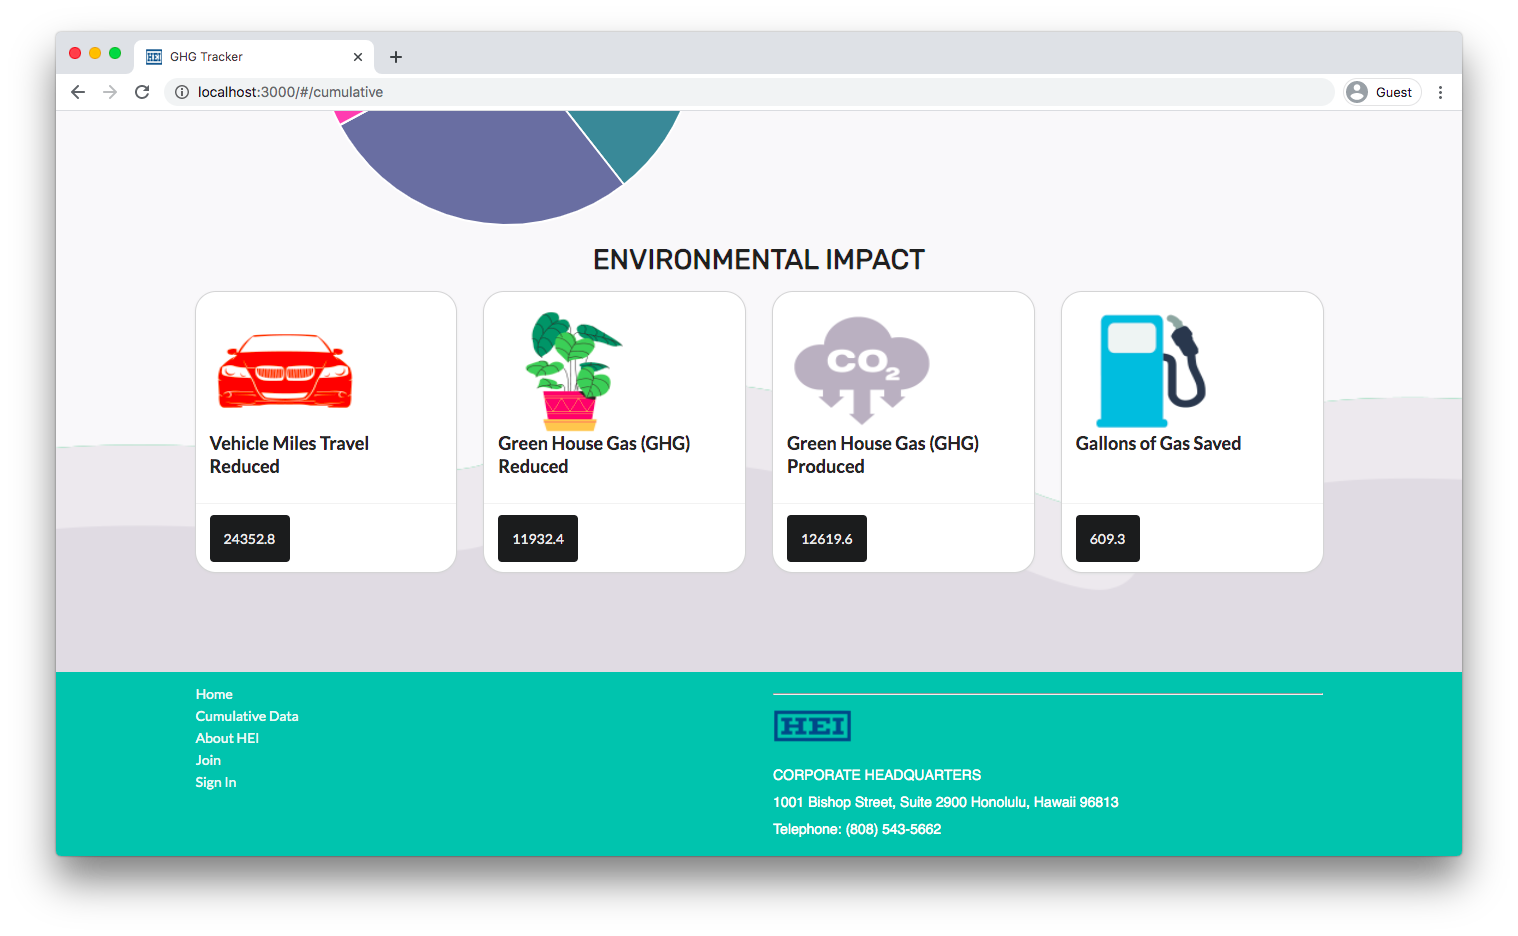
As well as a breakdown of the community’s CO2 produced, reduced, vehicle miles traveled, and gallons of gas saved:
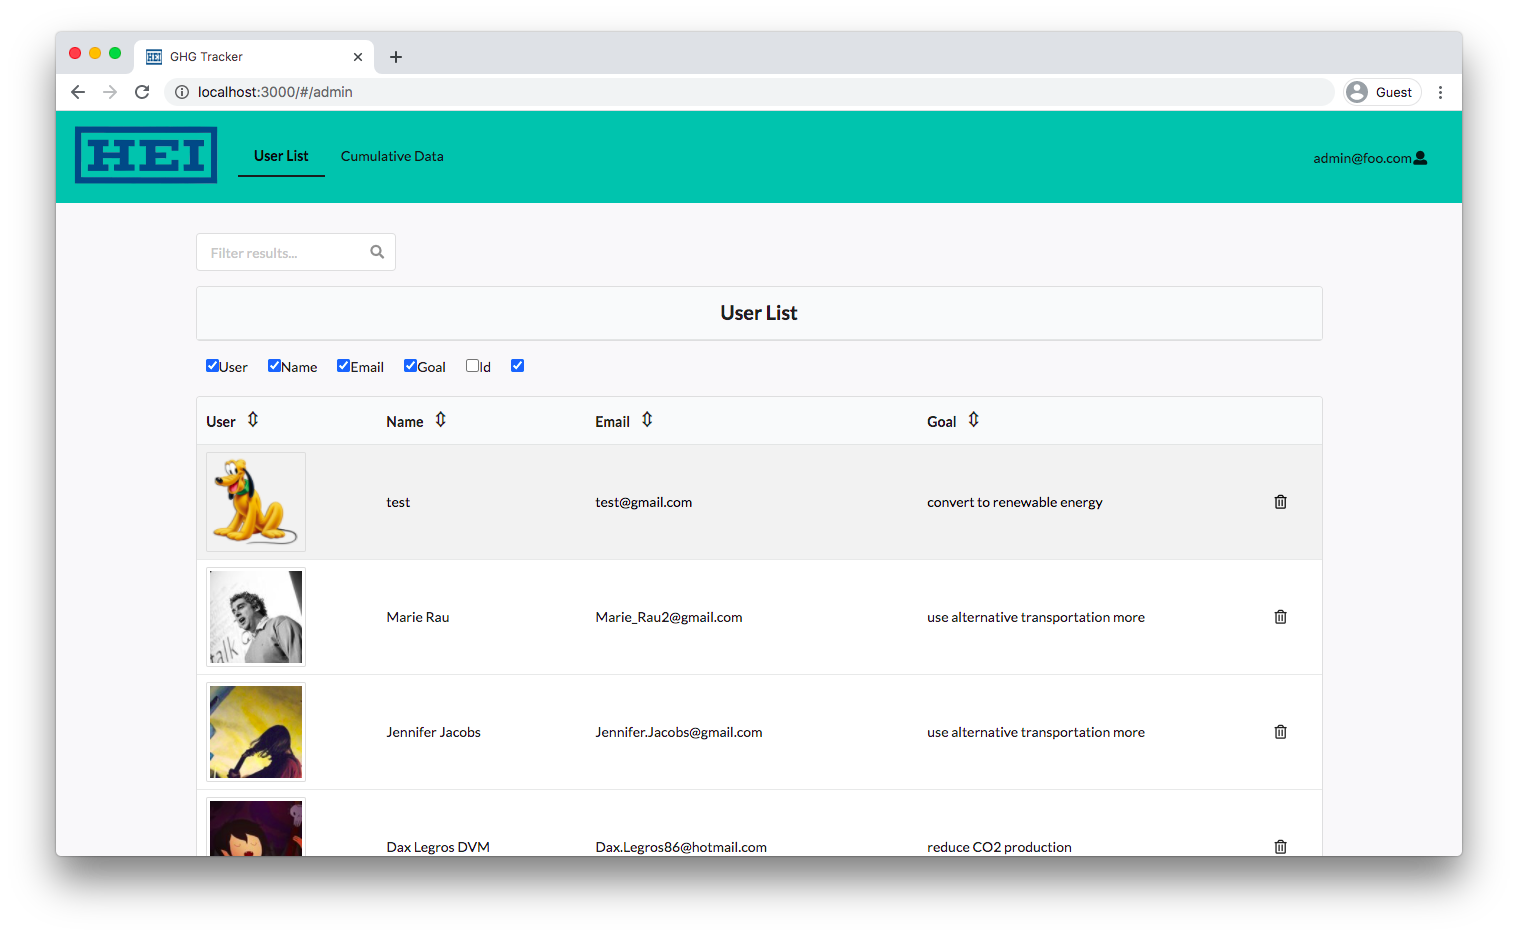
Administrative Pages
User List
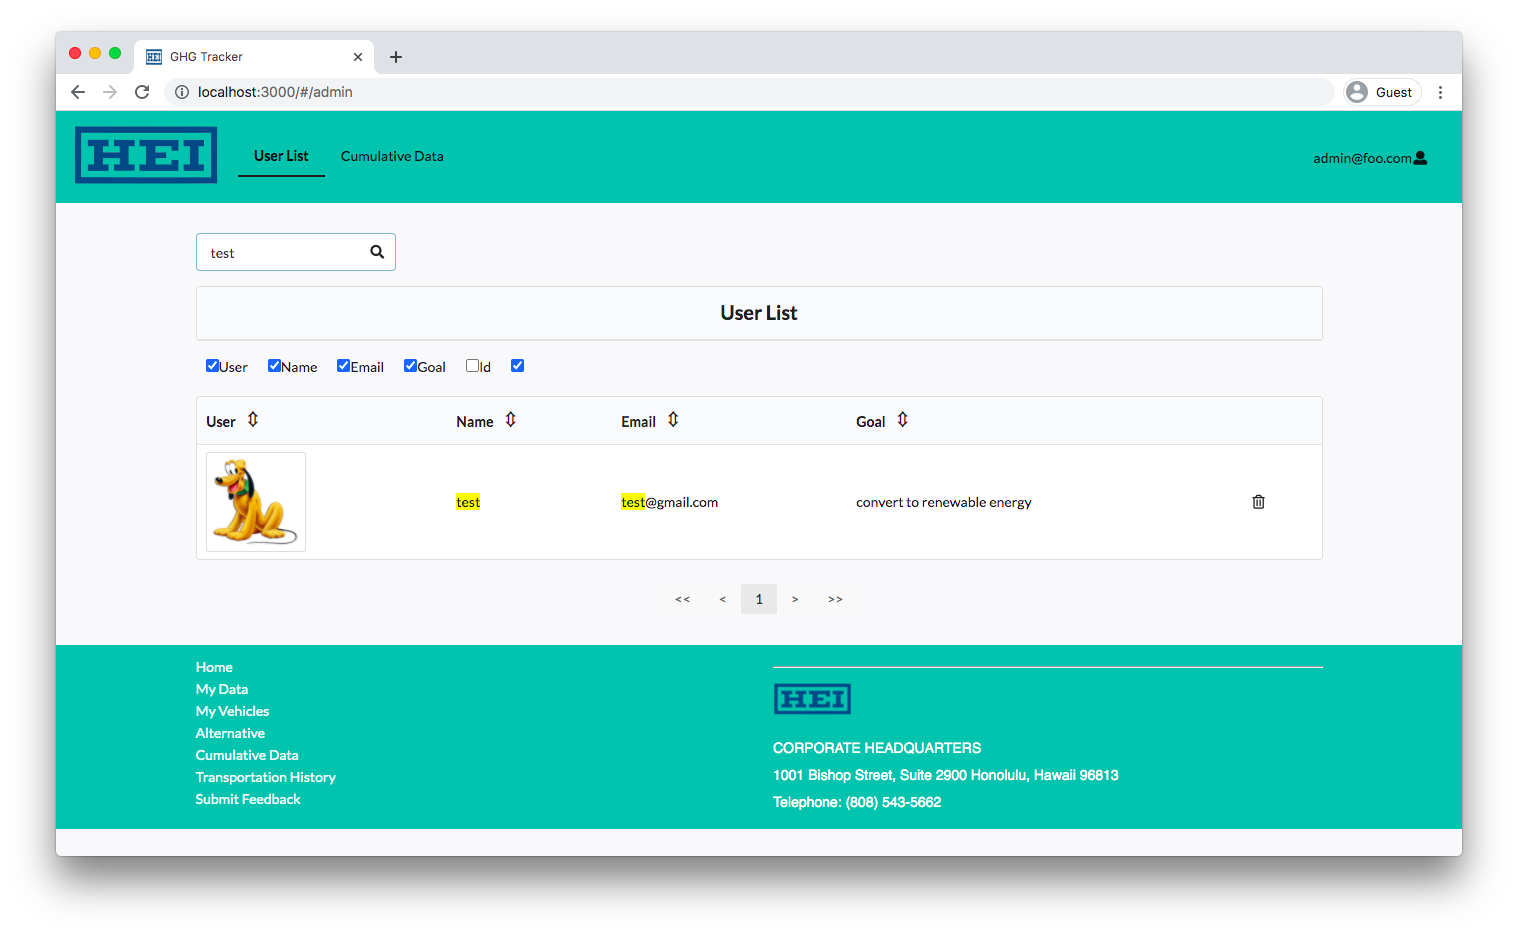
The administrators of the site are given a list of all of the users in the HEI application’s database, and are given the power to delete users, as well as display the users by certain attributes. Similarly, the administrator may search for a certain user by keywords. They are also able to view the cumulative data page.
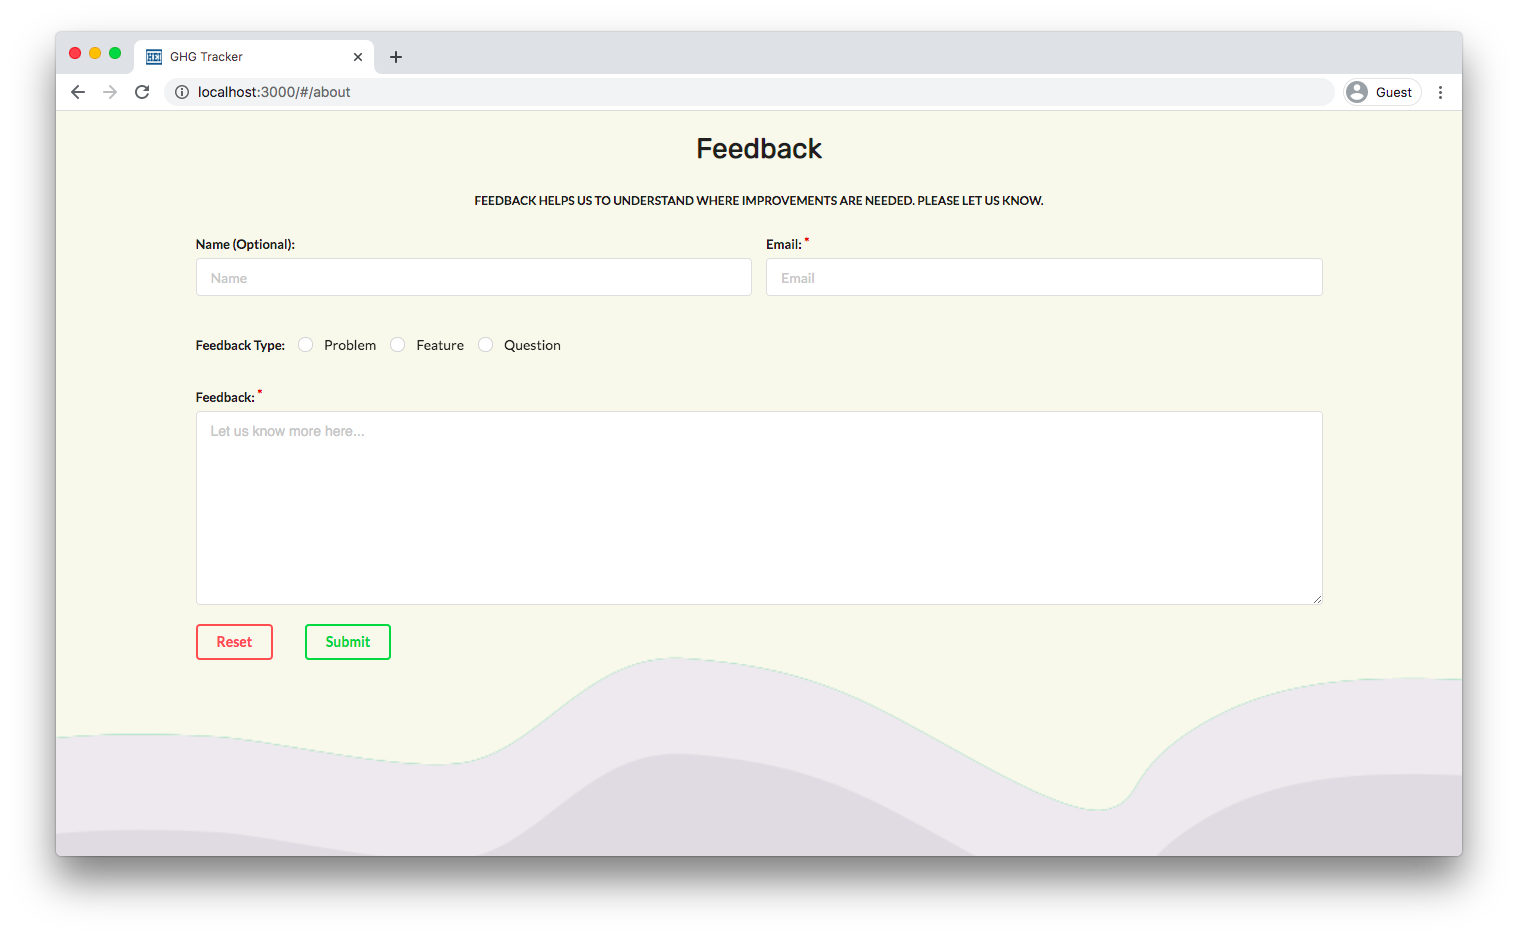
Feedback
Feedback is appreciated as it helps to improve the application’s functionalty. Users are able to submit feedback regarding features they want to see, problems that may occur while using the applications or any questions regarding accessibility or about the organization and application.
The Team:
Hot-n-Code is a team of passionate and hard-working undergraduate students from the University of Hawai’i at Manoa. They were grouped together for a class (ICS 414: Software Engineering II), by their professor, Dr. Carleton Moore. Since then, they have been working as a team to develop the GHG-Tracker project for Hawaiian Electric Industries.
Team Members
- Anna Campainha
- Chak Hon Lam
- Daphne Tapia
- Jackie Wong
- Michael Gainey
- Sophia Cruz
- Timothy Huo
- Khyla Rabang
- Yiwen Chen
Next Steps: Coming soon